Immigrants from Austria vs Cajun Disability Age Under 5
COMPARE
Immigrants from Austria
Cajun
Disability Age Under 5
Disability Age Under 5 Comparison
Immigrants from Austria
Cajuns
1.3%
DISABILITY AGE UNDER 5
2.3/ 100
METRIC RATING
239th/ 347
METRIC RANK
1.6%
DISABILITY AGE UNDER 5
0.0/ 100
METRIC RATING
298th/ 347
METRIC RANK
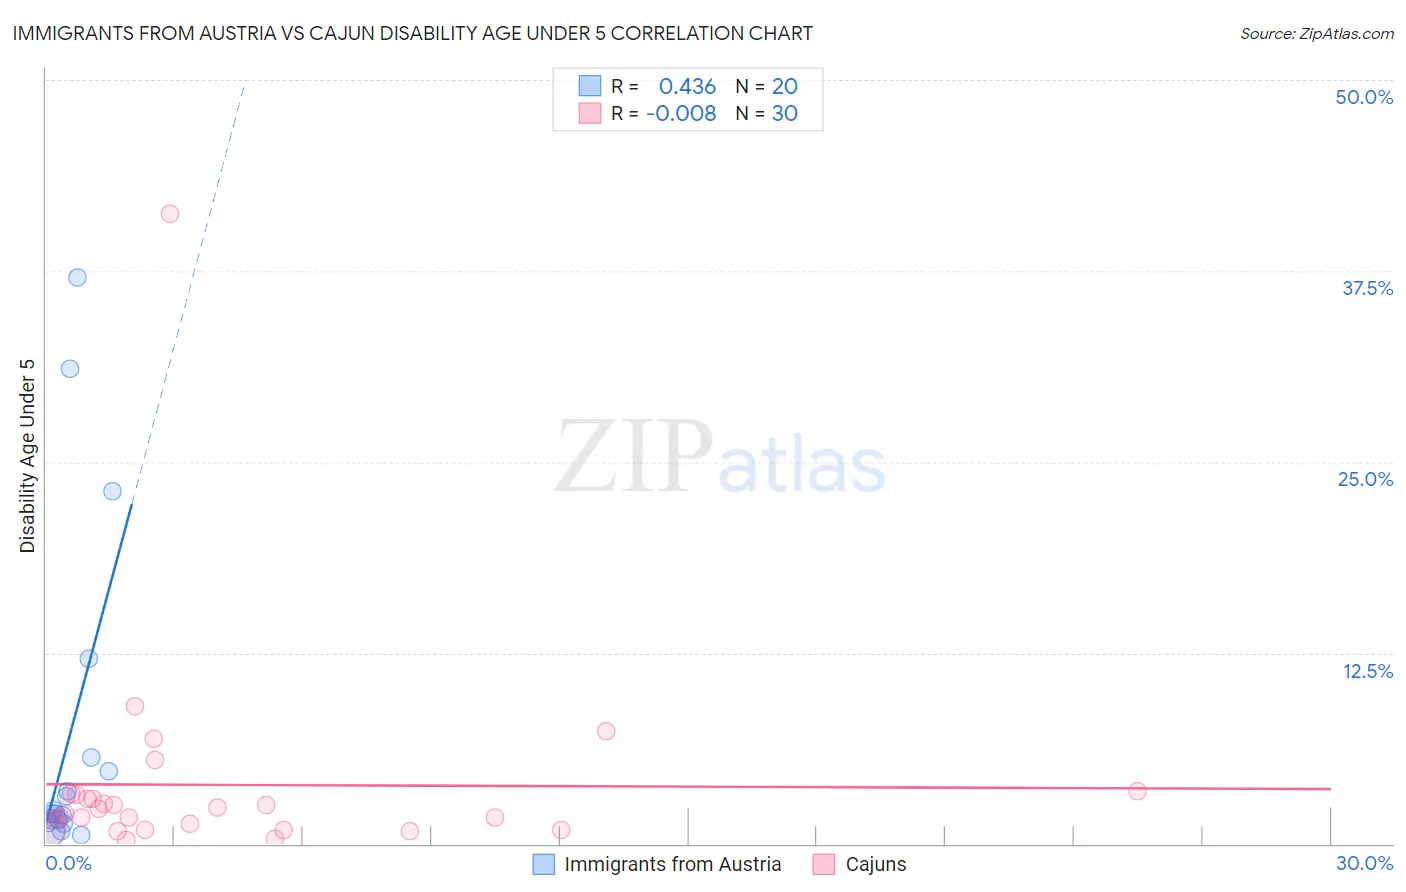
Immigrants from Austria vs Cajun Disability Age Under 5 Correlation Chart
The statistical analysis conducted on geographies consisting of 111,174,092 people shows a moderate positive correlation between the proportion of Immigrants from Austria and percentage of population with a disability under the age of 5 in the United States with a correlation coefficient (R) of 0.436 and weighted average of 1.3%. Similarly, the statistical analysis conducted on geographies consisting of 103,694,895 people shows no correlation between the proportion of Cajuns and percentage of population with a disability under the age of 5 in the United States with a correlation coefficient (R) of -0.008 and weighted average of 1.6%, a difference of 19.4%.
Disability Age Under 5 Correlation Summary
| Measurement | Immigrants from Austria | Cajun |
| Minimum | 0.55% | 0.26% |
| Maximum | 37.0% | 41.3% |
| Range | 36.5% | 41.0% |
| Mean | 6.9% | 3.9% |
| Median | 2.0% | 2.1% |
| Interquartile 25% (IQ1) | 1.5% | 0.93% |
| Interquartile 75% (IQ3) | 5.2% | 3.2% |
| Interquartile Range (IQR) | 3.7% | 2.3% |
| Standard Deviation (Sample) | 10.7% | 7.4% |
| Standard Deviation (Population) | 10.4% | 7.2% |
Similar Demographics by Disability Age Under 5
Demographics Similar to Immigrants from Austria by Disability Age Under 5
In terms of disability age under 5, the demographic groups most similar to Immigrants from Austria are Native Hawaiian (1.3%, a difference of 0.020%), Maltese (1.3%, a difference of 0.090%), Spanish American Indian (1.3%, a difference of 0.16%), Lumbee (1.3%, a difference of 0.18%), and Immigrants from Cameroon (1.4%, a difference of 0.56%).
| Demographics | Rating | Rank | Disability Age Under 5 |
| French American Indians | 4.5 /100 | #232 | Tragic 1.3% |
| Tongans | 4.2 /100 | #233 | Tragic 1.3% |
| Pueblo | 3.8 /100 | #234 | Tragic 1.3% |
| Central American Indians | 3.6 /100 | #235 | Tragic 1.3% |
| South American Indians | 3.3 /100 | #236 | Tragic 1.3% |
| Basques | 3.0 /100 | #237 | Tragic 1.3% |
| Spanish American Indians | 2.4 /100 | #238 | Tragic 1.3% |
| Immigrants | Austria | 2.3 /100 | #239 | Tragic 1.3% |
| Native Hawaiians | 2.2 /100 | #240 | Tragic 1.3% |
| Maltese | 2.2 /100 | #241 | Tragic 1.3% |
| Lumbee | 2.1 /100 | #242 | Tragic 1.3% |
| Immigrants | Cameroon | 1.7 /100 | #243 | Tragic 1.4% |
| Spaniards | 1.4 /100 | #244 | Tragic 1.4% |
| Potawatomi | 1.1 /100 | #245 | Tragic 1.4% |
| Russians | 1.0 /100 | #246 | Tragic 1.4% |
Demographics Similar to Cajuns by Disability Age Under 5
In terms of disability age under 5, the demographic groups most similar to Cajuns are Nonimmigrants (1.6%, a difference of 0.010%), Portuguese (1.6%, a difference of 0.57%), Shoshone (1.6%, a difference of 0.91%), Polish (1.6%, a difference of 0.96%), and Finnish (1.6%, a difference of 1.0%).
| Demographics | Rating | Rank | Disability Age Under 5 |
| Northern Europeans | 0.0 /100 | #291 | Tragic 1.6% |
| Italians | 0.0 /100 | #292 | Tragic 1.6% |
| Lithuanians | 0.0 /100 | #293 | Tragic 1.6% |
| Swedes | 0.0 /100 | #294 | Tragic 1.6% |
| Finns | 0.0 /100 | #295 | Tragic 1.6% |
| Poles | 0.0 /100 | #296 | Tragic 1.6% |
| Immigrants | Nonimmigrants | 0.0 /100 | #297 | Tragic 1.6% |
| Cajuns | 0.0 /100 | #298 | Tragic 1.6% |
| Portuguese | 0.0 /100 | #299 | Tragic 1.6% |
| Shoshone | 0.0 /100 | #300 | Tragic 1.6% |
| German Russians | 0.0 /100 | #301 | Tragic 1.6% |
| Welsh | 0.0 /100 | #302 | Tragic 1.6% |
| Swiss | 0.0 /100 | #303 | Tragic 1.6% |
| Seminole | 0.0 /100 | #304 | Tragic 1.6% |
| Blackfeet | 0.0 /100 | #305 | Tragic 1.6% |