Immigrants from Sweden vs Cajun Disability Age Under 5
COMPARE
Immigrants from Sweden
Cajun
Disability Age Under 5
Disability Age Under 5 Comparison
Immigrants from Sweden
Cajuns
1.1%
DISABILITY AGE UNDER 5
99.8/ 100
METRIC RATING
47th/ 347
METRIC RANK
1.6%
DISABILITY AGE UNDER 5
0.0/ 100
METRIC RATING
298th/ 347
METRIC RANK
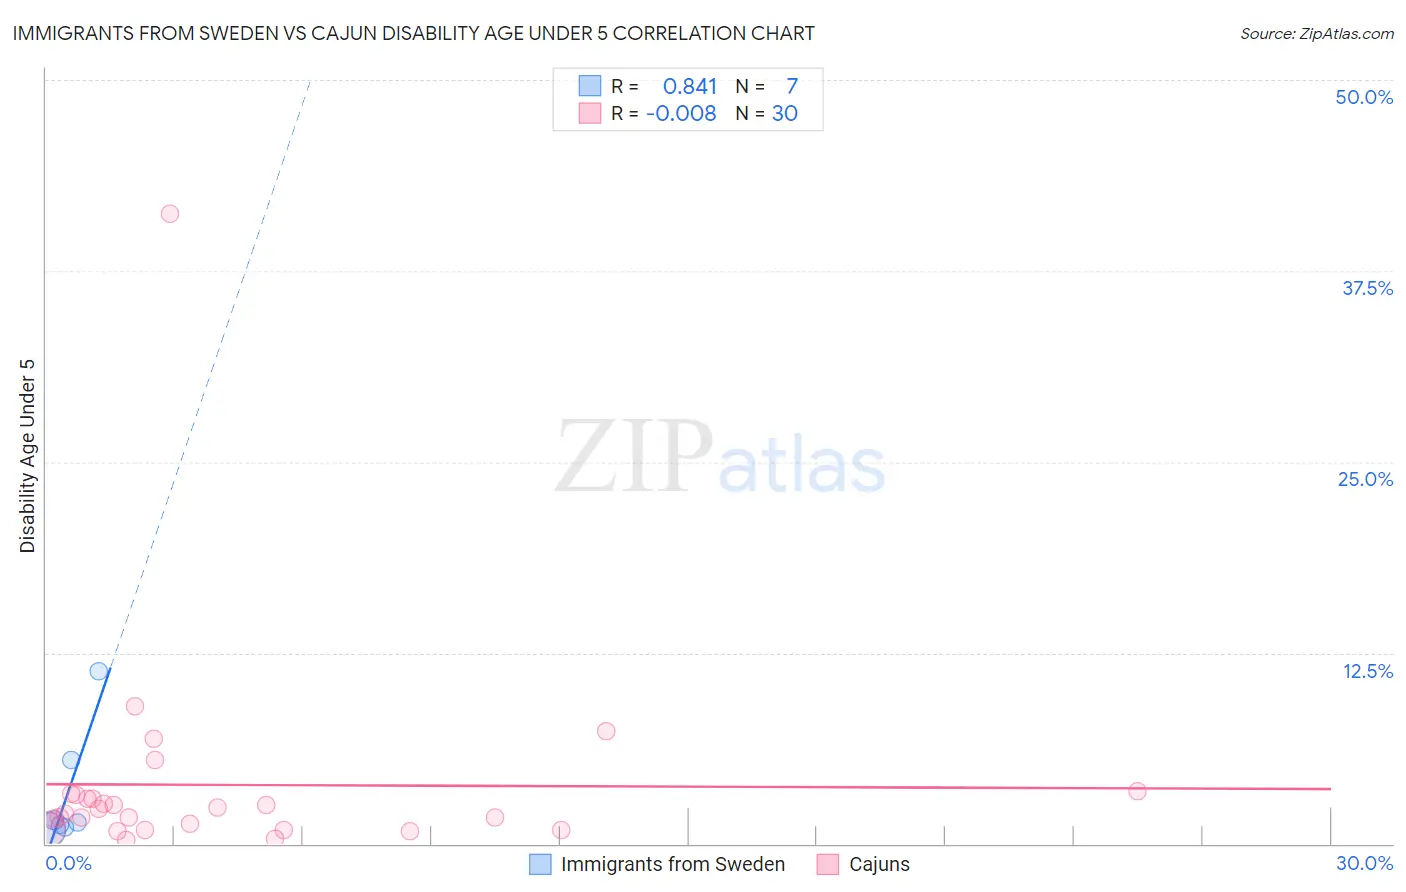
Immigrants from Sweden vs Cajun Disability Age Under 5 Correlation Chart
The statistical analysis conducted on geographies consisting of 109,268,889 people shows a very strong positive correlation between the proportion of Immigrants from Sweden and percentage of population with a disability under the age of 5 in the United States with a correlation coefficient (R) of 0.841 and weighted average of 1.1%. Similarly, the statistical analysis conducted on geographies consisting of 103,694,895 people shows no correlation between the proportion of Cajuns and percentage of population with a disability under the age of 5 in the United States with a correlation coefficient (R) of -0.008 and weighted average of 1.6%, a difference of 50.0%.
Disability Age Under 5 Correlation Summary
| Measurement | Immigrants from Sweden | Cajun |
| Minimum | 0.92% | 0.26% |
| Maximum | 11.3% | 41.3% |
| Range | 10.4% | 41.0% |
| Mean | 3.3% | 3.9% |
| Median | 1.4% | 2.1% |
| Interquartile 25% (IQ1) | 1.1% | 0.93% |
| Interquartile 75% (IQ3) | 5.5% | 3.2% |
| Interquartile Range (IQR) | 4.4% | 2.3% |
| Standard Deviation (Sample) | 3.9% | 7.4% |
| Standard Deviation (Population) | 3.6% | 7.2% |
Similar Demographics by Disability Age Under 5
Demographics Similar to Immigrants from Sweden by Disability Age Under 5
In terms of disability age under 5, the demographic groups most similar to Immigrants from Sweden are Immigrants from Congo (1.1%, a difference of 0.14%), Immigrants from Singapore (1.1%, a difference of 0.22%), Immigrants from Russia (1.1%, a difference of 0.43%), Immigrants from Japan (1.1%, a difference of 0.44%), and Immigrants from Turkey (1.1%, a difference of 0.54%).
| Demographics | Rating | Rank | Disability Age Under 5 |
| Immigrants | Albania | 99.9 /100 | #40 | Exceptional 1.1% |
| Thais | 99.8 /100 | #41 | Exceptional 1.1% |
| Immigrants | Bulgaria | 99.8 /100 | #42 | Exceptional 1.1% |
| Pima | 99.8 /100 | #43 | Exceptional 1.1% |
| Immigrants | Asia | 99.8 /100 | #44 | Exceptional 1.1% |
| Immigrants | Turkey | 99.8 /100 | #45 | Exceptional 1.1% |
| Immigrants | Congo | 99.8 /100 | #46 | Exceptional 1.1% |
| Immigrants | Sweden | 99.8 /100 | #47 | Exceptional 1.1% |
| Immigrants | Singapore | 99.7 /100 | #48 | Exceptional 1.1% |
| Immigrants | Russia | 99.7 /100 | #49 | Exceptional 1.1% |
| Immigrants | Japan | 99.7 /100 | #50 | Exceptional 1.1% |
| Immigrants | Kazakhstan | 99.7 /100 | #51 | Exceptional 1.1% |
| Immigrants | Bolivia | 99.6 /100 | #52 | Exceptional 1.1% |
| Asians | 99.6 /100 | #53 | Exceptional 1.1% |
| Immigrants | El Salvador | 99.6 /100 | #54 | Exceptional 1.1% |
Demographics Similar to Cajuns by Disability Age Under 5
In terms of disability age under 5, the demographic groups most similar to Cajuns are Nonimmigrants (1.6%, a difference of 0.010%), Portuguese (1.6%, a difference of 0.57%), Shoshone (1.6%, a difference of 0.91%), Polish (1.6%, a difference of 0.96%), and Finnish (1.6%, a difference of 1.0%).
| Demographics | Rating | Rank | Disability Age Under 5 |
| Northern Europeans | 0.0 /100 | #291 | Tragic 1.6% |
| Italians | 0.0 /100 | #292 | Tragic 1.6% |
| Lithuanians | 0.0 /100 | #293 | Tragic 1.6% |
| Swedes | 0.0 /100 | #294 | Tragic 1.6% |
| Finns | 0.0 /100 | #295 | Tragic 1.6% |
| Poles | 0.0 /100 | #296 | Tragic 1.6% |
| Immigrants | Nonimmigrants | 0.0 /100 | #297 | Tragic 1.6% |
| Cajuns | 0.0 /100 | #298 | Tragic 1.6% |
| Portuguese | 0.0 /100 | #299 | Tragic 1.6% |
| Shoshone | 0.0 /100 | #300 | Tragic 1.6% |
| German Russians | 0.0 /100 | #301 | Tragic 1.6% |
| Welsh | 0.0 /100 | #302 | Tragic 1.6% |
| Swiss | 0.0 /100 | #303 | Tragic 1.6% |
| Seminole | 0.0 /100 | #304 | Tragic 1.6% |
| Blackfeet | 0.0 /100 | #305 | Tragic 1.6% |