Immigrants from Cabo Verde vs Cajun Disability Age Under 5
COMPARE
Immigrants from Cabo Verde
Cajun
Disability Age Under 5
Disability Age Under 5 Comparison
Immigrants from Cabo Verde
Cajuns
1.7%
DISABILITY AGE UNDER 5
0.0/ 100
METRIC RATING
316th/ 347
METRIC RANK
1.6%
DISABILITY AGE UNDER 5
0.0/ 100
METRIC RATING
298th/ 347
METRIC RANK
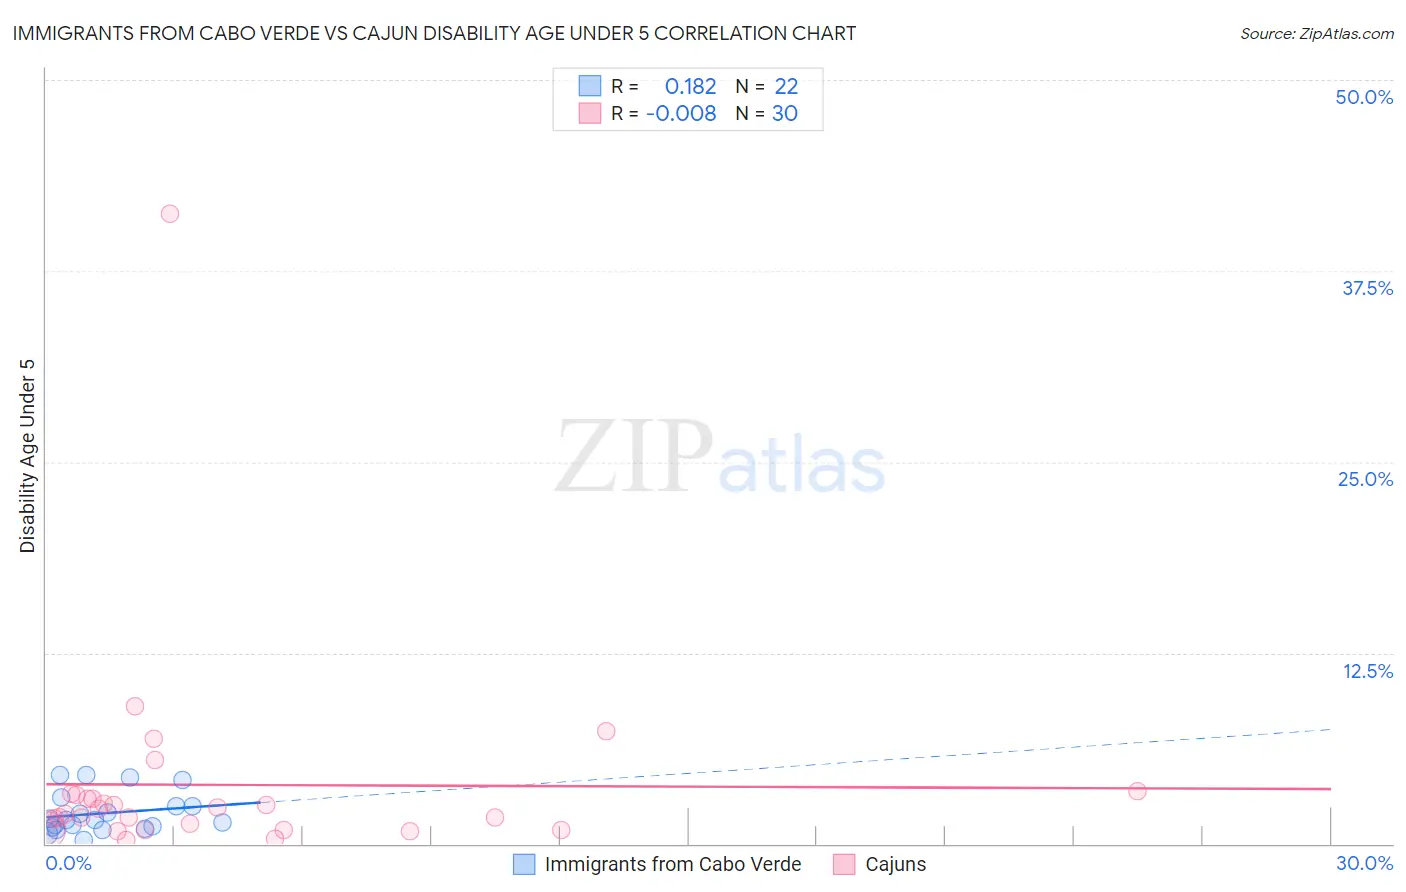
Immigrants from Cabo Verde vs Cajun Disability Age Under 5 Correlation Chart
The statistical analysis conducted on geographies consisting of 31,314,274 people shows a poor positive correlation between the proportion of Immigrants from Cabo Verde and percentage of population with a disability under the age of 5 in the United States with a correlation coefficient (R) of 0.182 and weighted average of 1.7%. Similarly, the statistical analysis conducted on geographies consisting of 103,694,895 people shows no correlation between the proportion of Cajuns and percentage of population with a disability under the age of 5 in the United States with a correlation coefficient (R) of -0.008 and weighted average of 1.6%, a difference of 4.9%.
Disability Age Under 5 Correlation Summary
| Measurement | Immigrants from Cabo Verde | Cajun |
| Minimum | 0.28% | 0.26% |
| Maximum | 4.5% | 41.3% |
| Range | 4.2% | 41.0% |
| Mean | 2.0% | 3.9% |
| Median | 1.5% | 2.1% |
| Interquartile 25% (IQ1) | 1.0% | 0.93% |
| Interquartile 75% (IQ3) | 2.4% | 3.2% |
| Interquartile Range (IQR) | 1.4% | 2.3% |
| Standard Deviation (Sample) | 1.3% | 7.4% |
| Standard Deviation (Population) | 1.3% | 7.2% |
Demographics Similar to Immigrants from Cabo Verde and Cajuns by Disability Age Under 5
In terms of disability age under 5, the demographic groups most similar to Immigrants from Cabo Verde are Dutch (1.7%, a difference of 0.18%), French (1.7%, a difference of 0.42%), Norwegian (1.7%, a difference of 0.44%), Celtic (1.7%, a difference of 0.60%), and Puerto Rican (1.7%, a difference of 0.77%). Similarly, the demographic groups most similar to Cajuns are Nonimmigrants (1.6%, a difference of 0.010%), Portuguese (1.6%, a difference of 0.57%), Shoshone (1.6%, a difference of 0.91%), German Russian (1.6%, a difference of 1.3%), and Welsh (1.6%, a difference of 1.5%).
| Demographics | Rating | Rank | Disability Age Under 5 |
| Immigrants | Nonimmigrants | 0.0 /100 | #297 | Tragic 1.6% |
| Cajuns | 0.0 /100 | #298 | Tragic 1.6% |
| Portuguese | 0.0 /100 | #299 | Tragic 1.6% |
| Shoshone | 0.0 /100 | #300 | Tragic 1.6% |
| German Russians | 0.0 /100 | #301 | Tragic 1.6% |
| Welsh | 0.0 /100 | #302 | Tragic 1.6% |
| Swiss | 0.0 /100 | #303 | Tragic 1.6% |
| Seminole | 0.0 /100 | #304 | Tragic 1.6% |
| Blackfeet | 0.0 /100 | #305 | Tragic 1.6% |
| Creek | 0.0 /100 | #306 | Tragic 1.6% |
| Scottish | 0.0 /100 | #307 | Tragic 1.6% |
| Navajo | 0.0 /100 | #308 | Tragic 1.6% |
| Cape Verdeans | 0.0 /100 | #309 | Tragic 1.7% |
| Whites/Caucasians | 0.0 /100 | #310 | Tragic 1.7% |
| English | 0.0 /100 | #311 | Tragic 1.7% |
| Puerto Ricans | 0.0 /100 | #312 | Tragic 1.7% |
| Celtics | 0.0 /100 | #313 | Tragic 1.7% |
| Norwegians | 0.0 /100 | #314 | Tragic 1.7% |
| Dutch | 0.0 /100 | #315 | Tragic 1.7% |
| Immigrants | Cabo Verde | 0.0 /100 | #316 | Tragic 1.7% |
| French | 0.0 /100 | #317 | Tragic 1.7% |