Immigrants from Austria vs Immigrants from India Disability Age Under 5
COMPARE
Immigrants from Austria
Immigrants from India
Disability Age Under 5
Disability Age Under 5 Comparison
Immigrants from Austria
Immigrants from India
1.3%
DISABILITY AGE UNDER 5
2.3/ 100
METRIC RATING
239th/ 347
METRIC RANK
1.0%
DISABILITY AGE UNDER 5
99.9/ 100
METRIC RATING
37th/ 347
METRIC RANK
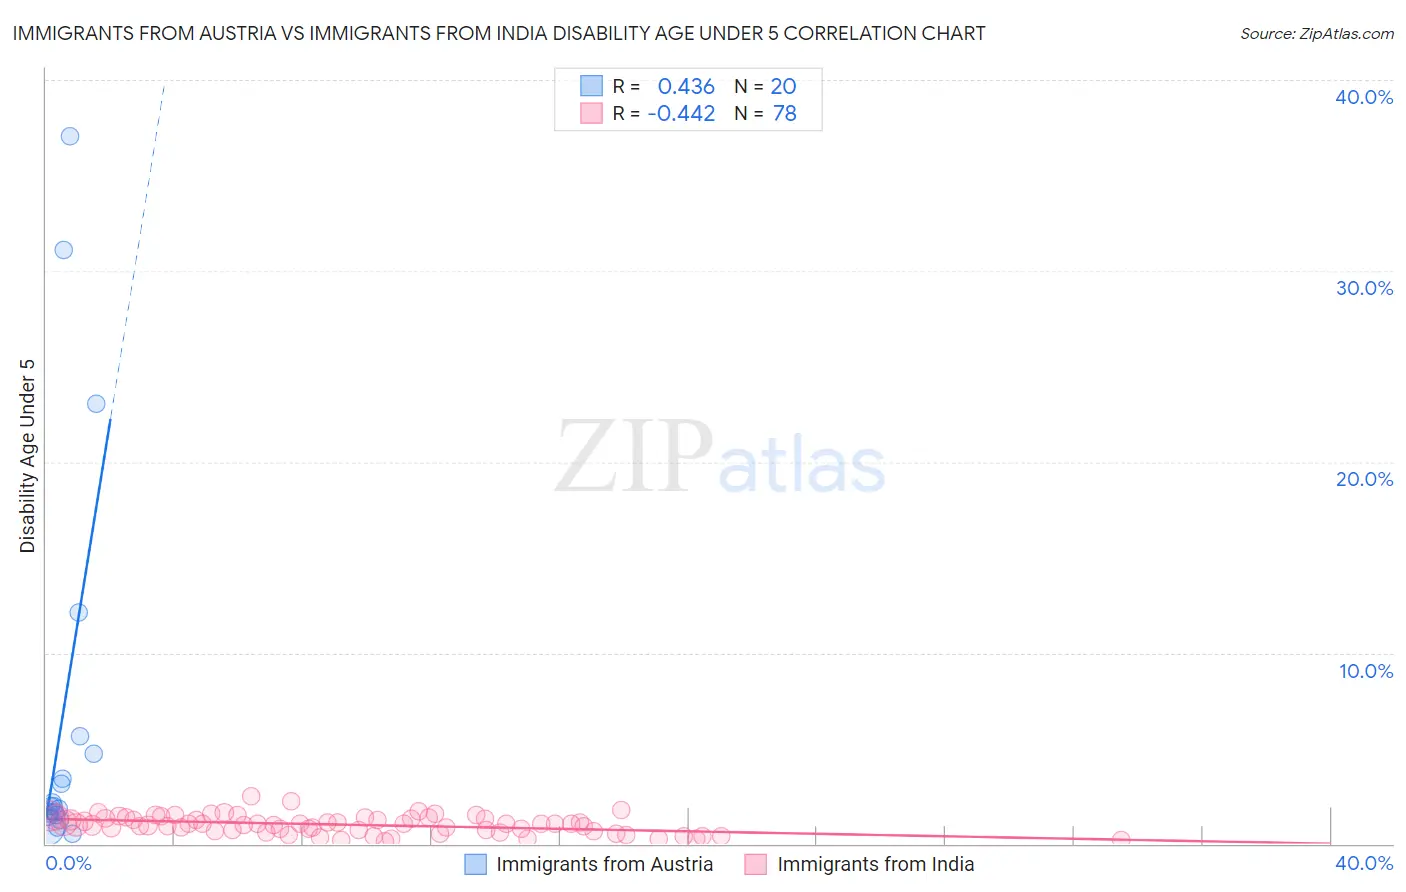
Immigrants from Austria vs Immigrants from India Disability Age Under 5 Correlation Chart
The statistical analysis conducted on geographies consisting of 111,174,092 people shows a moderate positive correlation between the proportion of Immigrants from Austria and percentage of population with a disability under the age of 5 in the United States with a correlation coefficient (R) of 0.436 and weighted average of 1.3%. Similarly, the statistical analysis conducted on geographies consisting of 228,217,406 people shows a moderate negative correlation between the proportion of Immigrants from India and percentage of population with a disability under the age of 5 in the United States with a correlation coefficient (R) of -0.442 and weighted average of 1.0%, a difference of 28.8%.
Disability Age Under 5 Correlation Summary
| Measurement | Immigrants from Austria | Immigrants from India |
| Minimum | 0.55% | 0.16% |
| Maximum | 37.0% | 2.5% |
| Range | 36.5% | 2.3% |
| Mean | 6.9% | 1.00% |
| Median | 2.0% | 1.0% |
| Interquartile 25% (IQ1) | 1.5% | 0.67% |
| Interquartile 75% (IQ3) | 5.2% | 1.3% |
| Interquartile Range (IQR) | 3.7% | 0.66% |
| Standard Deviation (Sample) | 10.7% | 0.47% |
| Standard Deviation (Population) | 10.4% | 0.47% |
Similar Demographics by Disability Age Under 5
Demographics Similar to Immigrants from Austria by Disability Age Under 5
In terms of disability age under 5, the demographic groups most similar to Immigrants from Austria are Native Hawaiian (1.3%, a difference of 0.020%), Maltese (1.3%, a difference of 0.090%), Spanish American Indian (1.3%, a difference of 0.16%), Lumbee (1.3%, a difference of 0.18%), and Immigrants from Cameroon (1.4%, a difference of 0.56%).
| Demographics | Rating | Rank | Disability Age Under 5 |
| French American Indians | 4.5 /100 | #232 | Tragic 1.3% |
| Tongans | 4.2 /100 | #233 | Tragic 1.3% |
| Pueblo | 3.8 /100 | #234 | Tragic 1.3% |
| Central American Indians | 3.6 /100 | #235 | Tragic 1.3% |
| South American Indians | 3.3 /100 | #236 | Tragic 1.3% |
| Basques | 3.0 /100 | #237 | Tragic 1.3% |
| Spanish American Indians | 2.4 /100 | #238 | Tragic 1.3% |
| Immigrants | Austria | 2.3 /100 | #239 | Tragic 1.3% |
| Native Hawaiians | 2.2 /100 | #240 | Tragic 1.3% |
| Maltese | 2.2 /100 | #241 | Tragic 1.3% |
| Lumbee | 2.1 /100 | #242 | Tragic 1.3% |
| Immigrants | Cameroon | 1.7 /100 | #243 | Tragic 1.4% |
| Spaniards | 1.4 /100 | #244 | Tragic 1.4% |
| Potawatomi | 1.1 /100 | #245 | Tragic 1.4% |
| Russians | 1.0 /100 | #246 | Tragic 1.4% |
Demographics Similar to Immigrants from India by Disability Age Under 5
In terms of disability age under 5, the demographic groups most similar to Immigrants from India are Immigrants from Nepal (1.0%, a difference of 0.020%), Immigrants from Guyana (1.0%, a difference of 0.080%), Barbadian (1.0%, a difference of 0.73%), Filipino (1.1%, a difference of 0.76%), and Immigrants from Ukraine (1.0%, a difference of 0.97%).
| Demographics | Rating | Rank | Disability Age Under 5 |
| Immigrants | South Central Asia | 99.9 /100 | #30 | Exceptional 1.0% |
| Armenians | 99.9 /100 | #31 | Exceptional 1.0% |
| Iranians | 99.9 /100 | #32 | Exceptional 1.0% |
| Bolivians | 99.9 /100 | #33 | Exceptional 1.0% |
| Immigrants | Ukraine | 99.9 /100 | #34 | Exceptional 1.0% |
| Barbadians | 99.9 /100 | #35 | Exceptional 1.0% |
| Immigrants | Nepal | 99.9 /100 | #36 | Exceptional 1.0% |
| Immigrants | India | 99.9 /100 | #37 | Exceptional 1.0% |
| Immigrants | Guyana | 99.9 /100 | #38 | Exceptional 1.0% |
| Filipinos | 99.9 /100 | #39 | Exceptional 1.1% |
| Immigrants | Albania | 99.9 /100 | #40 | Exceptional 1.1% |
| Thais | 99.8 /100 | #41 | Exceptional 1.1% |
| Immigrants | Bulgaria | 99.8 /100 | #42 | Exceptional 1.1% |
| Pima | 99.8 /100 | #43 | Exceptional 1.1% |
| Immigrants | Asia | 99.8 /100 | #44 | Exceptional 1.1% |