Immigrants from Austria vs Chickasaw Disability Age Under 5
COMPARE
Immigrants from Austria
Chickasaw
Disability Age Under 5
Disability Age Under 5 Comparison
Immigrants from Austria
Chickasaw
1.3%
DISABILITY AGE UNDER 5
2.3/ 100
METRIC RATING
239th/ 347
METRIC RANK
1.7%
DISABILITY AGE UNDER 5
0.0/ 100
METRIC RATING
323rd/ 347
METRIC RANK
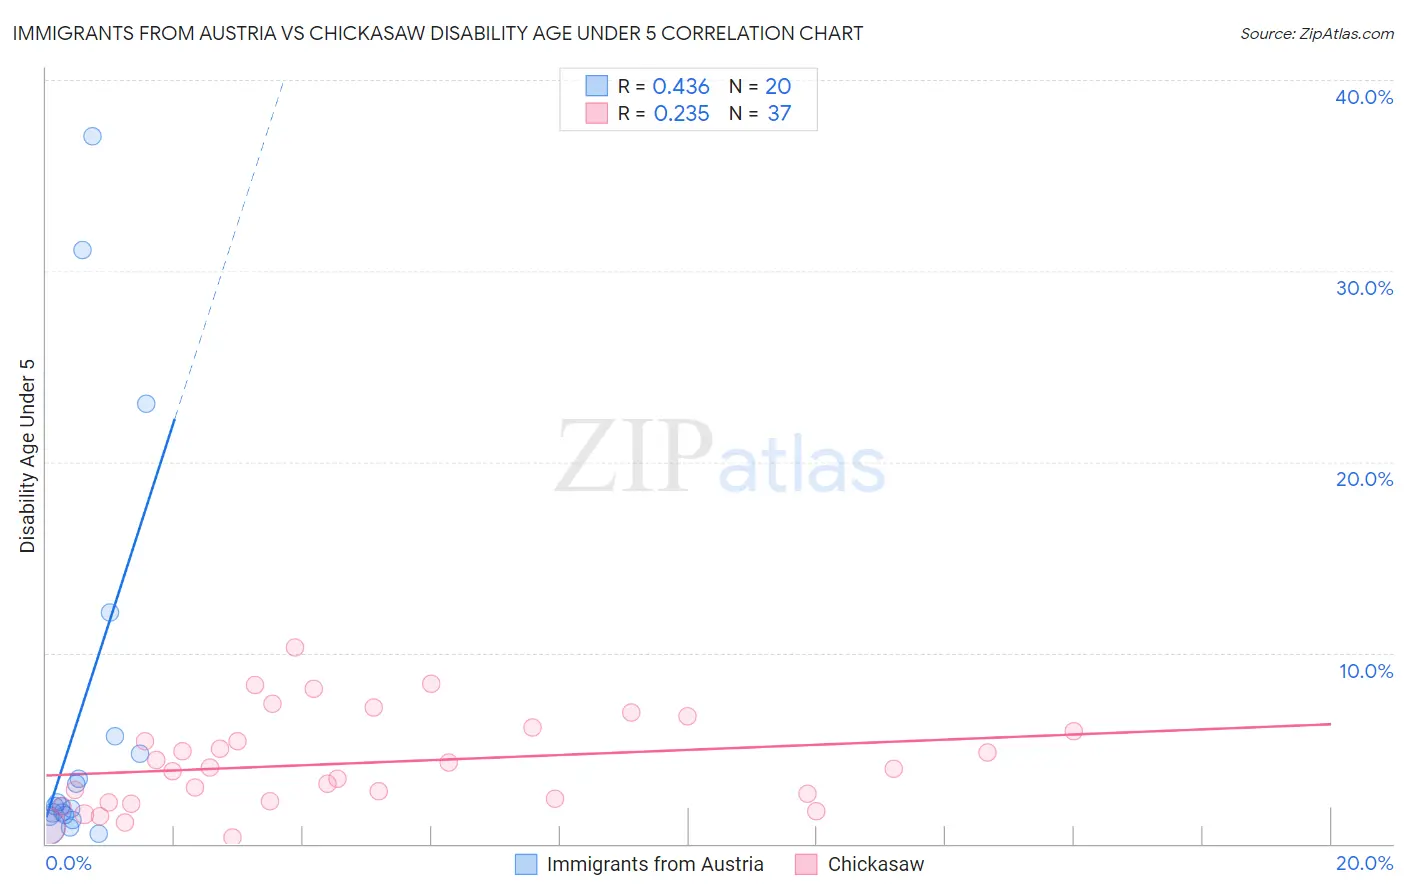
Immigrants from Austria vs Chickasaw Disability Age Under 5 Correlation Chart
The statistical analysis conducted on geographies consisting of 111,174,092 people shows a moderate positive correlation between the proportion of Immigrants from Austria and percentage of population with a disability under the age of 5 in the United States with a correlation coefficient (R) of 0.436 and weighted average of 1.3%. Similarly, the statistical analysis conducted on geographies consisting of 108,085,172 people shows a weak positive correlation between the proportion of Chickasaw and percentage of population with a disability under the age of 5 in the United States with a correlation coefficient (R) of 0.235 and weighted average of 1.7%, a difference of 29.3%.
Disability Age Under 5 Correlation Summary
| Measurement | Immigrants from Austria | Chickasaw |
| Minimum | 0.55% | 0.31% |
| Maximum | 37.0% | 10.3% |
| Range | 36.5% | 10.0% |
| Mean | 6.9% | 4.2% |
| Median | 2.0% | 3.9% |
| Interquartile 25% (IQ1) | 1.5% | 2.2% |
| Interquartile 75% (IQ3) | 5.2% | 6.0% |
| Interquartile Range (IQR) | 3.7% | 3.8% |
| Standard Deviation (Sample) | 10.7% | 2.5% |
| Standard Deviation (Population) | 10.4% | 2.4% |
Similar Demographics by Disability Age Under 5
Demographics Similar to Immigrants from Austria by Disability Age Under 5
In terms of disability age under 5, the demographic groups most similar to Immigrants from Austria are Native Hawaiian (1.3%, a difference of 0.020%), Maltese (1.3%, a difference of 0.090%), Spanish American Indian (1.3%, a difference of 0.16%), Lumbee (1.3%, a difference of 0.18%), and Immigrants from Cameroon (1.4%, a difference of 0.56%).
| Demographics | Rating | Rank | Disability Age Under 5 |
| French American Indians | 4.5 /100 | #232 | Tragic 1.3% |
| Tongans | 4.2 /100 | #233 | Tragic 1.3% |
| Pueblo | 3.8 /100 | #234 | Tragic 1.3% |
| Central American Indians | 3.6 /100 | #235 | Tragic 1.3% |
| South American Indians | 3.3 /100 | #236 | Tragic 1.3% |
| Basques | 3.0 /100 | #237 | Tragic 1.3% |
| Spanish American Indians | 2.4 /100 | #238 | Tragic 1.3% |
| Immigrants | Austria | 2.3 /100 | #239 | Tragic 1.3% |
| Native Hawaiians | 2.2 /100 | #240 | Tragic 1.3% |
| Maltese | 2.2 /100 | #241 | Tragic 1.3% |
| Lumbee | 2.1 /100 | #242 | Tragic 1.3% |
| Immigrants | Cameroon | 1.7 /100 | #243 | Tragic 1.4% |
| Spaniards | 1.4 /100 | #244 | Tragic 1.4% |
| Potawatomi | 1.1 /100 | #245 | Tragic 1.4% |
| Russians | 1.0 /100 | #246 | Tragic 1.4% |
Demographics Similar to Chickasaw by Disability Age Under 5
In terms of disability age under 5, the demographic groups most similar to Chickasaw are German (1.7%, a difference of 1.1%), Ottawa (1.7%, a difference of 1.7%), Scotch-Irish (1.7%, a difference of 1.8%), Cherokee (1.8%, a difference of 1.8%), and Slovak (1.7%, a difference of 2.3%).
| Demographics | Rating | Rank | Disability Age Under 5 |
| Immigrants | Cabo Verde | 0.0 /100 | #316 | Tragic 1.7% |
| French | 0.0 /100 | #317 | Tragic 1.7% |
| Irish | 0.0 /100 | #318 | Tragic 1.7% |
| Slovaks | 0.0 /100 | #319 | Tragic 1.7% |
| Scotch-Irish | 0.0 /100 | #320 | Tragic 1.7% |
| Ottawa | 0.0 /100 | #321 | Tragic 1.7% |
| Germans | 0.0 /100 | #322 | Tragic 1.7% |
| Chickasaw | 0.0 /100 | #323 | Tragic 1.7% |
| Cherokee | 0.0 /100 | #324 | Tragic 1.8% |
| Immigrants | Portugal | 0.0 /100 | #325 | Tragic 1.8% |
| Sioux | 0.0 /100 | #326 | Tragic 1.8% |
| Osage | 0.0 /100 | #327 | Tragic 1.8% |
| Americans | 0.0 /100 | #328 | Tragic 1.9% |
| Houma | 0.0 /100 | #329 | Tragic 1.9% |
| Choctaw | 0.0 /100 | #330 | Tragic 1.9% |