Immigrants from Argentina vs Immigrants from Jordan Self-Care Disability
COMPARE
Immigrants from Argentina
Immigrants from Jordan
Self-Care Disability
Self-Care Disability Comparison
Immigrants from Argentina
Immigrants from Jordan
2.3%
SELF-CARE DISABILITY
99.3/ 100
METRIC RATING
66th/ 347
METRIC RANK
2.4%
SELF-CARE DISABILITY
97.7/ 100
METRIC RATING
91st/ 347
METRIC RANK
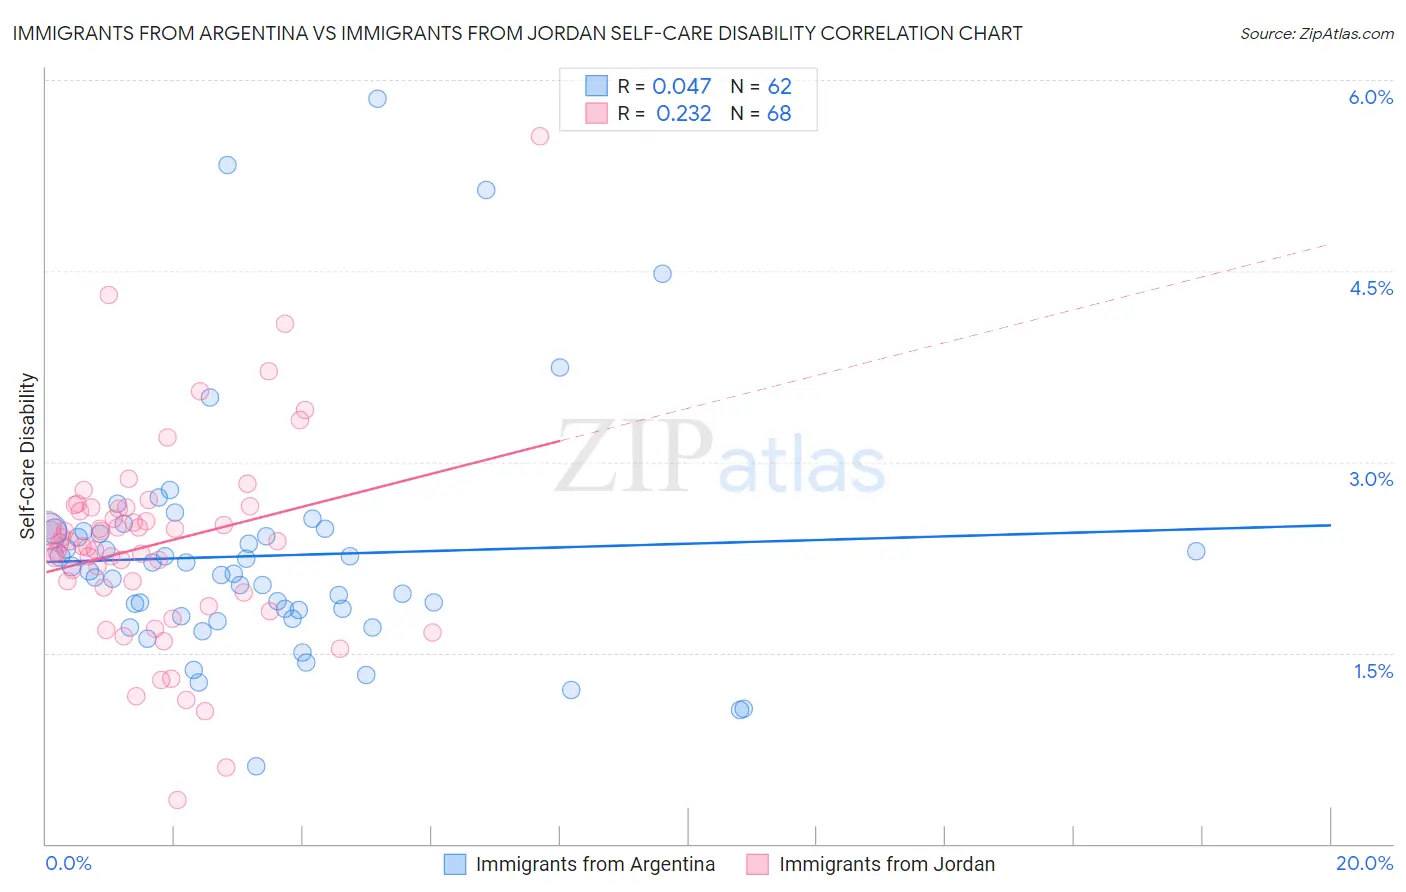
Immigrants from Argentina vs Immigrants from Jordan Self-Care Disability Correlation Chart
The statistical analysis conducted on geographies consisting of 264,279,860 people shows no correlation between the proportion of Immigrants from Argentina and percentage of population with self-care disability in the United States with a correlation coefficient (R) of 0.047 and weighted average of 2.3%. Similarly, the statistical analysis conducted on geographies consisting of 181,224,885 people shows a weak positive correlation between the proportion of Immigrants from Jordan and percentage of population with self-care disability in the United States with a correlation coefficient (R) of 0.232 and weighted average of 2.4%, a difference of 1.5%.
Self-Care Disability Correlation Summary
| Measurement | Immigrants from Argentina | Immigrants from Jordan |
| Minimum | 0.61% | 0.35% |
| Maximum | 5.8% | 5.6% |
| Range | 5.2% | 5.2% |
| Mean | 2.3% | 2.4% |
| Median | 2.1% | 2.4% |
| Interquartile 25% (IQ1) | 1.8% | 2.0% |
| Interquartile 75% (IQ3) | 2.5% | 2.6% |
| Interquartile Range (IQR) | 0.66% | 0.64% |
| Standard Deviation (Sample) | 0.95% | 0.80% |
| Standard Deviation (Population) | 0.94% | 0.80% |
Similar Demographics by Self-Care Disability
Demographics Similar to Immigrants from Argentina by Self-Care Disability
In terms of self-care disability, the demographic groups most similar to Immigrants from Argentina are Brazilian (2.3%, a difference of 0.030%), South African (2.3%, a difference of 0.030%), Swedish (2.3%, a difference of 0.090%), Mongolian (2.3%, a difference of 0.10%), and Immigrants from Zaire (2.3%, a difference of 0.12%).
| Demographics | Rating | Rank | Self-Care Disability |
| New Zealanders | 99.5 /100 | #59 | Exceptional 2.3% |
| Immigrants | Japan | 99.5 /100 | #60 | Exceptional 2.3% |
| Palestinians | 99.4 /100 | #61 | Exceptional 2.3% |
| Egyptians | 99.4 /100 | #62 | Exceptional 2.3% |
| Mongolians | 99.3 /100 | #63 | Exceptional 2.3% |
| Swedes | 99.3 /100 | #64 | Exceptional 2.3% |
| Brazilians | 99.3 /100 | #65 | Exceptional 2.3% |
| Immigrants | Argentina | 99.3 /100 | #66 | Exceptional 2.3% |
| South Africans | 99.3 /100 | #67 | Exceptional 2.3% |
| Immigrants | Zaire | 99.2 /100 | #68 | Exceptional 2.3% |
| Immigrants | Norway | 99.2 /100 | #69 | Exceptional 2.3% |
| Immigrants | Northern Europe | 99.2 /100 | #70 | Exceptional 2.3% |
| Asians | 99.2 /100 | #71 | Exceptional 2.3% |
| Eastern Europeans | 99.2 /100 | #72 | Exceptional 2.3% |
| Immigrants | Egypt | 99.1 /100 | #73 | Exceptional 2.3% |
Demographics Similar to Immigrants from Jordan by Self-Care Disability
In terms of self-care disability, the demographic groups most similar to Immigrants from Jordan are Immigrants from Czechoslovakia (2.4%, a difference of 0.010%), Icelander (2.4%, a difference of 0.14%), Immigrants from Congo (2.4%, a difference of 0.15%), Sierra Leonean (2.4%, a difference of 0.20%), and Lithuanian (2.4%, a difference of 0.20%).
| Demographics | Rating | Rank | Self-Care Disability |
| Immigrants | Spain | 98.7 /100 | #84 | Exceptional 2.3% |
| Estonians | 98.3 /100 | #85 | Exceptional 2.3% |
| Immigrants | Northern Africa | 98.2 /100 | #86 | Exceptional 2.3% |
| Sierra Leoneans | 98.0 /100 | #87 | Exceptional 2.4% |
| Lithuanians | 98.0 /100 | #88 | Exceptional 2.4% |
| Immigrants | Congo | 98.0 /100 | #89 | Exceptional 2.4% |
| Immigrants | Czechoslovakia | 97.7 /100 | #90 | Exceptional 2.4% |
| Immigrants | Jordan | 97.7 /100 | #91 | Exceptional 2.4% |
| Icelanders | 97.4 /100 | #92 | Exceptional 2.4% |
| Immigrants | Latvia | 97.0 /100 | #93 | Exceptional 2.4% |
| Macedonians | 96.9 /100 | #94 | Exceptional 2.4% |
| Immigrants | Asia | 96.9 /100 | #95 | Exceptional 2.4% |
| Immigrants | Chile | 96.7 /100 | #96 | Exceptional 2.4% |
| Swiss | 96.6 /100 | #97 | Exceptional 2.4% |
| Immigrants | Poland | 96.4 /100 | #98 | Exceptional 2.4% |