Immigrants from Albania vs African Single Father Households
COMPARE
Immigrants from Albania
African
Single Father Households
Single Father Households Comparison
Immigrants from Albania
Africans
1.9%
SINGLE FATHER HOUSEHOLDS
100.0/ 100
METRIC RATING
21st/ 347
METRIC RANK
2.5%
SINGLE FATHER HOUSEHOLDS
6.3/ 100
METRIC RATING
234th/ 347
METRIC RANK
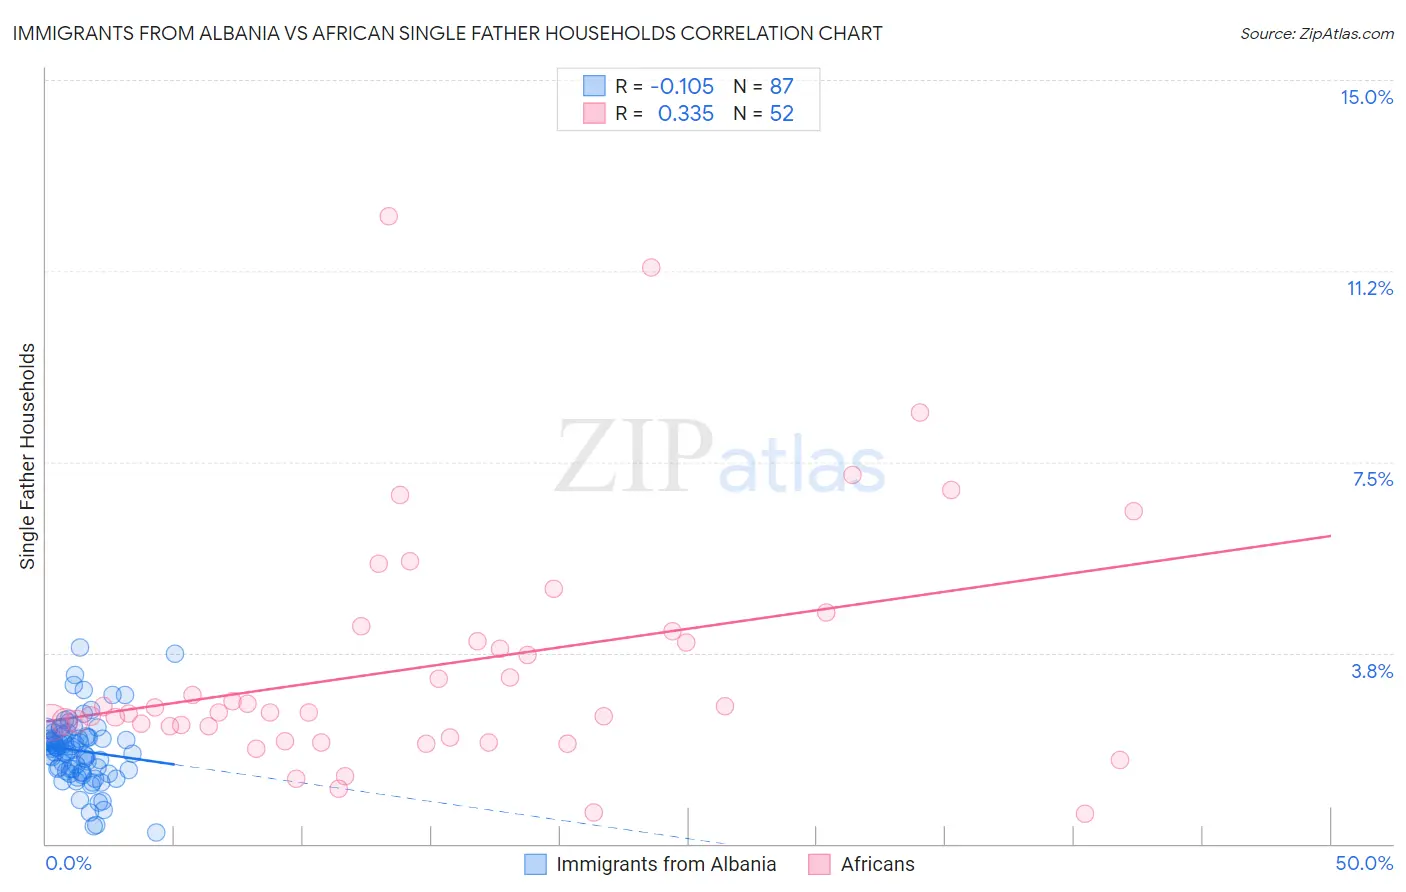
Immigrants from Albania vs African Single Father Households Correlation Chart
The statistical analysis conducted on geographies consisting of 118,928,765 people shows a poor negative correlation between the proportion of Immigrants from Albania and percentage of single father households in the United States with a correlation coefficient (R) of -0.105 and weighted average of 1.9%. Similarly, the statistical analysis conducted on geographies consisting of 464,994,675 people shows a mild positive correlation between the proportion of Africans and percentage of single father households in the United States with a correlation coefficient (R) of 0.335 and weighted average of 2.5%, a difference of 27.2%.
Single Father Households Correlation Summary
| Measurement | Immigrants from Albania | African |
| Minimum | 0.23% | 0.60% |
| Maximum | 3.8% | 12.3% |
| Range | 3.6% | 11.7% |
| Mean | 1.8% | 3.5% |
| Median | 1.9% | 2.6% |
| Interquartile 25% (IQ1) | 1.4% | 2.2% |
| Interquartile 75% (IQ3) | 2.1% | 4.1% |
| Interquartile Range (IQR) | 0.70% | 1.9% |
| Standard Deviation (Sample) | 0.66% | 2.4% |
| Standard Deviation (Population) | 0.66% | 2.4% |
Similar Demographics by Single Father Households
Demographics Similar to Immigrants from Albania by Single Father Households
In terms of single father households, the demographic groups most similar to Immigrants from Albania are Immigrants from Latvia (1.9%, a difference of 0.19%), Thai (1.9%, a difference of 0.30%), Iranian (1.9%, a difference of 0.37%), Indian (Asian) (1.9%, a difference of 1.2%), and Immigrants from Croatia (2.0%, a difference of 1.4%).
| Demographics | Rating | Rank | Single Father Households |
| Immigrants | Lithuania | 100.0 /100 | #14 | Exceptional 1.9% |
| Immigrants | Eastern Asia | 100.0 /100 | #15 | Exceptional 1.9% |
| Immigrants | Iran | 100.0 /100 | #16 | Exceptional 1.9% |
| Immigrants | India | 100.0 /100 | #17 | Exceptional 1.9% |
| Indians (Asian) | 100.0 /100 | #18 | Exceptional 1.9% |
| Iranians | 100.0 /100 | #19 | Exceptional 1.9% |
| Thais | 100.0 /100 | #20 | Exceptional 1.9% |
| Immigrants | Albania | 100.0 /100 | #21 | Exceptional 1.9% |
| Immigrants | Latvia | 100.0 /100 | #22 | Exceptional 1.9% |
| Immigrants | Croatia | 100.0 /100 | #23 | Exceptional 2.0% |
| Immigrants | Russia | 100.0 /100 | #24 | Exceptional 2.0% |
| Eastern Europeans | 100.0 /100 | #25 | Exceptional 2.0% |
| Assyrians/Chaldeans/Syriacs | 100.0 /100 | #26 | Exceptional 2.0% |
| Immigrants | South Central Asia | 100.0 /100 | #27 | Exceptional 2.0% |
| Immigrants | Japan | 100.0 /100 | #28 | Exceptional 2.0% |
Demographics Similar to Africans by Single Father Households
In terms of single father households, the demographic groups most similar to Africans are Immigrants (2.5%, a difference of 0.020%), Cajun (2.5%, a difference of 0.070%), Sierra Leonean (2.5%, a difference of 0.12%), Immigrants from Sierra Leone (2.5%, a difference of 0.15%), and Immigrants from Oceania (2.5%, a difference of 0.16%).
| Demographics | Rating | Rank | Single Father Households |
| Americans | 9.3 /100 | #227 | Tragic 2.4% |
| Immigrants | Ghana | 9.1 /100 | #228 | Tragic 2.4% |
| Immigrants | Zaire | 8.6 /100 | #229 | Tragic 2.4% |
| Sub-Saharan Africans | 8.3 /100 | #230 | Tragic 2.4% |
| Immigrants | Nonimmigrants | 7.6 /100 | #231 | Tragic 2.4% |
| Pennsylvania Germans | 7.3 /100 | #232 | Tragic 2.4% |
| Immigrants | Western Africa | 7.0 /100 | #233 | Tragic 2.4% |
| Africans | 6.3 /100 | #234 | Tragic 2.5% |
| Immigrants | Immigrants | 6.3 /100 | #235 | Tragic 2.5% |
| Cajuns | 6.1 /100 | #236 | Tragic 2.5% |
| Sierra Leoneans | 5.9 /100 | #237 | Tragic 2.5% |
| Immigrants | Sierra Leone | 5.8 /100 | #238 | Tragic 2.5% |
| Immigrants | Oceania | 5.8 /100 | #239 | Tragic 2.5% |
| Immigrants | Dominica | 4.8 /100 | #240 | Tragic 2.5% |
| Portuguese | 4.1 /100 | #241 | Tragic 2.5% |