Immigrants from Albania vs Crow Disability Age 5 to 17
COMPARE
Immigrants from Albania
Crow
Disability Age 5 to 17
Disability Age 5 to 17 Comparison
Immigrants from Albania
Crow
5.5%
DISABILITY AGE 5 TO 17
83.1/ 100
METRIC RATING
147th/ 347
METRIC RANK
5.4%
DISABILITY AGE 5 TO 17
95.0/ 100
METRIC RATING
124th/ 347
METRIC RANK
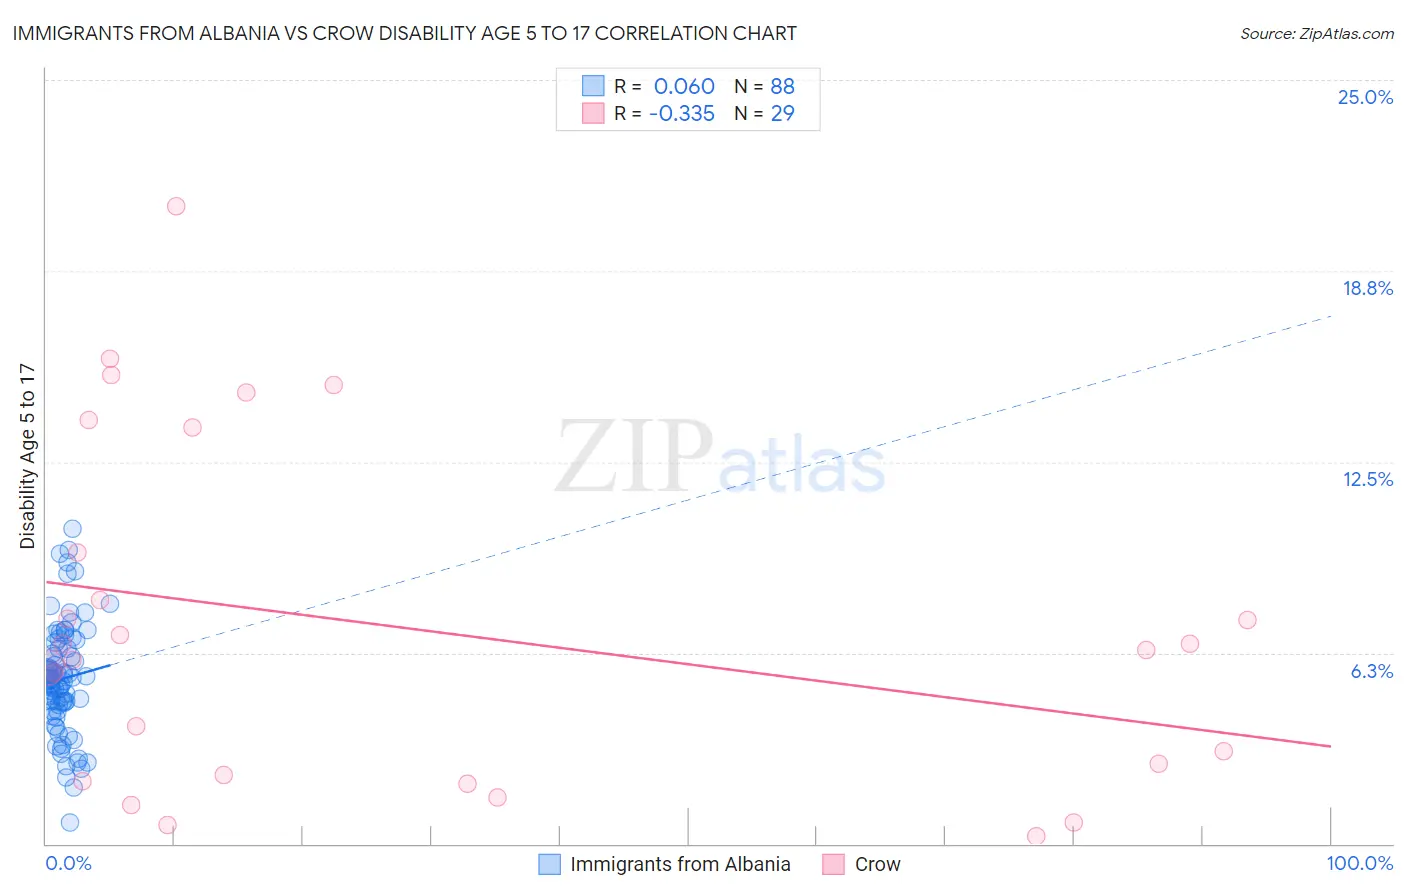
Immigrants from Albania vs Crow Disability Age 5 to 17 Correlation Chart
The statistical analysis conducted on geographies consisting of 119,036,367 people shows a slight positive correlation between the proportion of Immigrants from Albania and percentage of population with a disability between the ages 5 and 17 in the United States with a correlation coefficient (R) of 0.060 and weighted average of 5.5%. Similarly, the statistical analysis conducted on geographies consisting of 59,063,912 people shows a mild negative correlation between the proportion of Crow and percentage of population with a disability between the ages 5 and 17 in the United States with a correlation coefficient (R) of -0.335 and weighted average of 5.4%, a difference of 1.8%.
Disability Age 5 to 17 Correlation Summary
| Measurement | Immigrants from Albania | Crow |
| Minimum | 0.68% | 0.26% |
| Maximum | 10.3% | 20.9% |
| Range | 9.6% | 20.6% |
| Mean | 5.4% | 7.1% |
| Median | 5.4% | 6.4% |
| Interquartile 25% (IQ1) | 4.6% | 2.1% |
| Interquartile 75% (IQ3) | 6.5% | 11.6% |
| Interquartile Range (IQR) | 1.9% | 9.4% |
| Standard Deviation (Sample) | 1.8% | 5.6% |
| Standard Deviation (Population) | 1.8% | 5.5% |
Similar Demographics by Disability Age 5 to 17
Demographics Similar to Immigrants from Albania by Disability Age 5 to 17
In terms of disability age 5 to 17, the demographic groups most similar to Immigrants from Albania are Albanian (5.5%, a difference of 0.060%), Samoan (5.5%, a difference of 0.10%), Central American (5.5%, a difference of 0.13%), Guatemalan (5.5%, a difference of 0.13%), and Estonian (5.5%, a difference of 0.20%).
| Demographics | Rating | Rank | Disability Age 5 to 17 |
| Immigrants | Netherlands | 90.5 /100 | #140 | Exceptional 5.4% |
| South American Indians | 89.3 /100 | #141 | Excellent 5.5% |
| Colombians | 88.0 /100 | #142 | Excellent 5.5% |
| Immigrants | Hungary | 87.9 /100 | #143 | Excellent 5.5% |
| Pakistanis | 87.3 /100 | #144 | Excellent 5.5% |
| Immigrants | Guatemala | 86.6 /100 | #145 | Excellent 5.5% |
| Albanians | 83.7 /100 | #146 | Excellent 5.5% |
| Immigrants | Albania | 83.1 /100 | #147 | Excellent 5.5% |
| Samoans | 81.9 /100 | #148 | Excellent 5.5% |
| Central Americans | 81.6 /100 | #149 | Excellent 5.5% |
| Guatemalans | 81.5 /100 | #150 | Excellent 5.5% |
| Estonians | 80.8 /100 | #151 | Excellent 5.5% |
| Ute | 80.6 /100 | #152 | Excellent 5.5% |
| Ecuadorians | 79.7 /100 | #153 | Good 5.5% |
| Australians | 78.8 /100 | #154 | Good 5.5% |
Demographics Similar to Crow by Disability Age 5 to 17
In terms of disability age 5 to 17, the demographic groups most similar to Crow are Immigrants from Chile (5.4%, a difference of 0.010%), New Zealander (5.4%, a difference of 0.020%), Latvian (5.4%, a difference of 0.030%), Immigrants from Ethiopia (5.4%, a difference of 0.13%), and Immigrants from Venezuela (5.4%, a difference of 0.14%).
| Demographics | Rating | Rank | Disability Age 5 to 17 |
| Immigrants | Afghanistan | 97.4 /100 | #117 | Exceptional 5.3% |
| South Americans | 97.1 /100 | #118 | Exceptional 5.4% |
| Immigrants | South America | 97.1 /100 | #119 | Exceptional 5.4% |
| Immigrants | Immigrants | 97.0 /100 | #120 | Exceptional 5.4% |
| Maltese | 96.0 /100 | #121 | Exceptional 5.4% |
| Chileans | 95.8 /100 | #122 | Exceptional 5.4% |
| Immigrants | Ethiopia | 95.5 /100 | #123 | Exceptional 5.4% |
| Crow | 95.0 /100 | #124 | Exceptional 5.4% |
| Immigrants | Chile | 95.0 /100 | #125 | Exceptional 5.4% |
| New Zealanders | 95.0 /100 | #126 | Exceptional 5.4% |
| Latvians | 95.0 /100 | #127 | Exceptional 5.4% |
| Immigrants | Venezuela | 94.5 /100 | #128 | Exceptional 5.4% |
| Romanians | 94.1 /100 | #129 | Exceptional 5.4% |
| Immigrants | Bulgaria | 94.0 /100 | #130 | Exceptional 5.4% |
| Arabs | 92.9 /100 | #131 | Exceptional 5.4% |