Immigrants from Afghanistan vs Alaskan Athabascan Disability
COMPARE
Immigrants from Afghanistan
Alaskan Athabascan
Disability
Disability Comparison
Immigrants from Afghanistan
Alaskan Athabascans
11.0%
DISABILITY
99.6/ 100
METRIC RATING
68th/ 347
METRIC RANK
14.4%
DISABILITY
0.0/ 100
METRIC RATING
331st/ 347
METRIC RANK
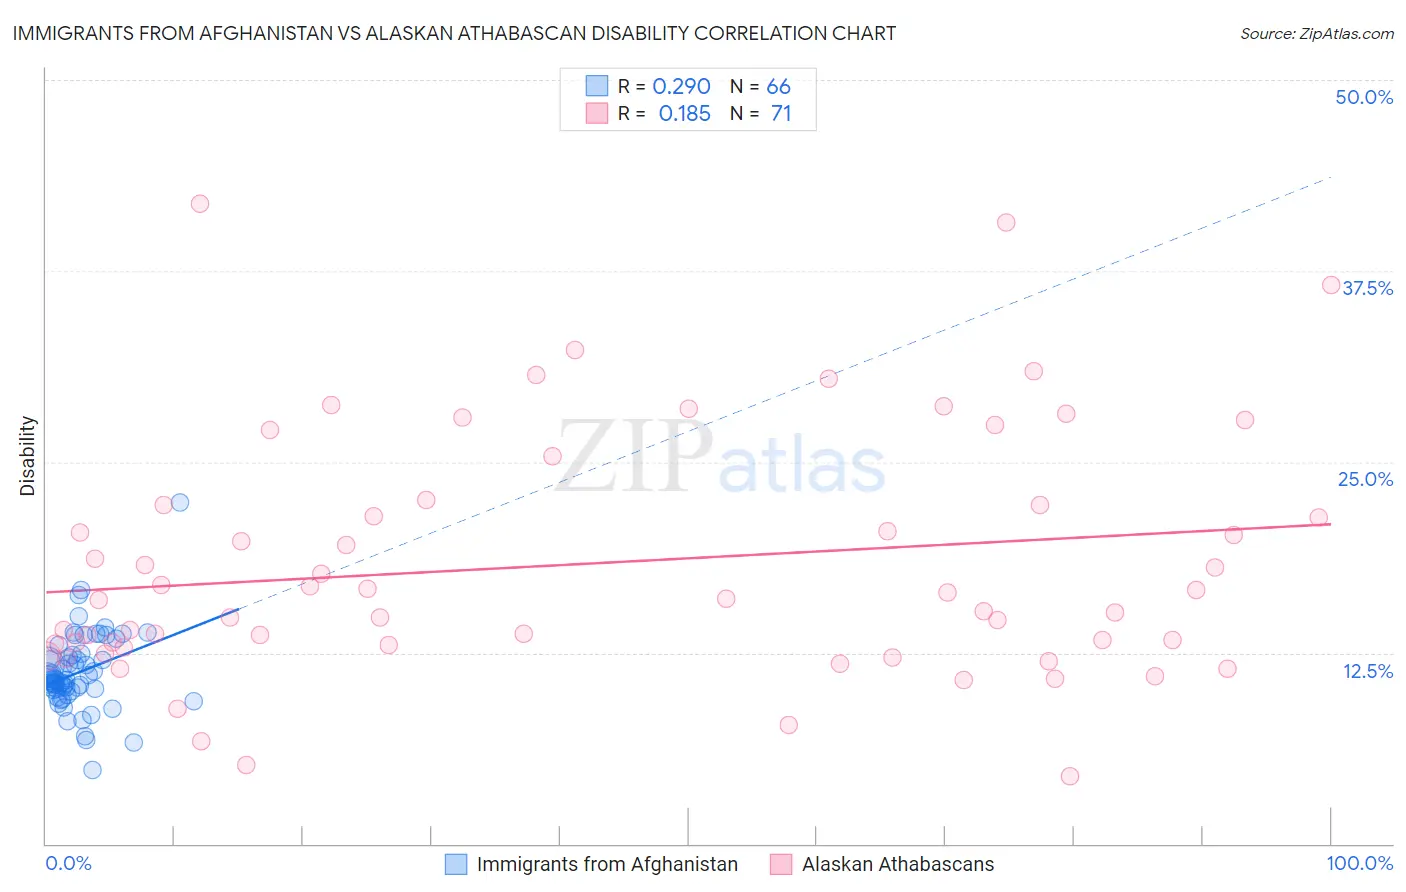
Immigrants from Afghanistan vs Alaskan Athabascan Disability Correlation Chart
The statistical analysis conducted on geographies consisting of 147,638,051 people shows a weak positive correlation between the proportion of Immigrants from Afghanistan and percentage of population with a disability in the United States with a correlation coefficient (R) of 0.290 and weighted average of 11.0%. Similarly, the statistical analysis conducted on geographies consisting of 45,821,092 people shows a poor positive correlation between the proportion of Alaskan Athabascans and percentage of population with a disability in the United States with a correlation coefficient (R) of 0.185 and weighted average of 14.4%, a difference of 31.4%.
Disability Correlation Summary
| Measurement | Immigrants from Afghanistan | Alaskan Athabascan |
| Minimum | 4.8% | 4.4% |
| Maximum | 22.3% | 41.9% |
| Range | 17.5% | 37.5% |
| Mean | 11.2% | 18.3% |
| Median | 10.7% | 16.0% |
| Interquartile 25% (IQ1) | 10.1% | 13.0% |
| Interquartile 75% (IQ3) | 12.3% | 22.2% |
| Interquartile Range (IQR) | 2.3% | 9.2% |
| Standard Deviation (Sample) | 2.6% | 8.0% |
| Standard Deviation (Population) | 2.6% | 8.0% |
Similar Demographics by Disability
Demographics Similar to Immigrants from Afghanistan by Disability
In terms of disability, the demographic groups most similar to Immigrants from Afghanistan are Colombian (11.0%, a difference of 0.12%), Laotian (11.0%, a difference of 0.20%), Sri Lankan (11.0%, a difference of 0.21%), Bulgarian (11.0%, a difference of 0.22%), and Immigrants from Sweden (11.0%, a difference of 0.24%).
| Demographics | Rating | Rank | Disability |
| Immigrants | Bulgaria | 99.7 /100 | #61 | Exceptional 10.9% |
| Immigrants | Northern Africa | 99.7 /100 | #62 | Exceptional 10.9% |
| Immigrants | Eritrea | 99.7 /100 | #63 | Exceptional 11.0% |
| Immigrants | Sweden | 99.6 /100 | #64 | Exceptional 11.0% |
| Bulgarians | 99.6 /100 | #65 | Exceptional 11.0% |
| Laotians | 99.6 /100 | #66 | Exceptional 11.0% |
| Colombians | 99.6 /100 | #67 | Exceptional 11.0% |
| Immigrants | Afghanistan | 99.6 /100 | #68 | Exceptional 11.0% |
| Sri Lankans | 99.5 /100 | #69 | Exceptional 11.0% |
| Immigrants | France | 99.4 /100 | #70 | Exceptional 11.0% |
| Immigrants | Lebanon | 99.4 /100 | #71 | Exceptional 11.0% |
| Immigrants | Chile | 99.4 /100 | #72 | Exceptional 11.0% |
| Immigrants | Bangladesh | 99.4 /100 | #73 | Exceptional 11.0% |
| Immigrants | Serbia | 99.4 /100 | #74 | Exceptional 11.0% |
| Immigrants | Vietnam | 99.4 /100 | #75 | Exceptional 11.0% |
Demographics Similar to Alaskan Athabascans by Disability
In terms of disability, the demographic groups most similar to Alaskan Athabascans are Pueblo (14.4%, a difference of 0.020%), Cajun (14.6%, a difference of 1.1%), Yuman (14.6%, a difference of 1.2%), Navajo (14.3%, a difference of 1.3%), and Potawatomi (14.2%, a difference of 1.9%).
| Demographics | Rating | Rank | Disability |
| Chippewa | 0.0 /100 | #324 | Tragic 14.1% |
| Natives/Alaskans | 0.0 /100 | #325 | Tragic 14.2% |
| Osage | 0.0 /100 | #326 | Tragic 14.2% |
| Ottawa | 0.0 /100 | #327 | Tragic 14.2% |
| Immigrants | Azores | 0.0 /100 | #328 | Tragic 14.2% |
| Potawatomi | 0.0 /100 | #329 | Tragic 14.2% |
| Navajo | 0.0 /100 | #330 | Tragic 14.3% |
| Alaskan Athabascans | 0.0 /100 | #331 | Tragic 14.4% |
| Pueblo | 0.0 /100 | #332 | Tragic 14.4% |
| Cajuns | 0.0 /100 | #333 | Tragic 14.6% |
| Yuman | 0.0 /100 | #334 | Tragic 14.6% |
| Tohono O'odham | 0.0 /100 | #335 | Tragic 14.8% |
| Cherokee | 0.0 /100 | #336 | Tragic 14.8% |
| Seminole | 0.0 /100 | #337 | Tragic 14.9% |
| Dutch West Indians | 0.0 /100 | #338 | Tragic 14.9% |