Immigrants from Afghanistan vs Hungarian Disability
COMPARE
Immigrants from Afghanistan
Hungarian
Disability
Disability Comparison
Immigrants from Afghanistan
Hungarians
11.0%
DISABILITY
99.6/ 100
METRIC RATING
68th/ 347
METRIC RANK
12.2%
DISABILITY
1.7/ 100
METRIC RATING
240th/ 347
METRIC RANK
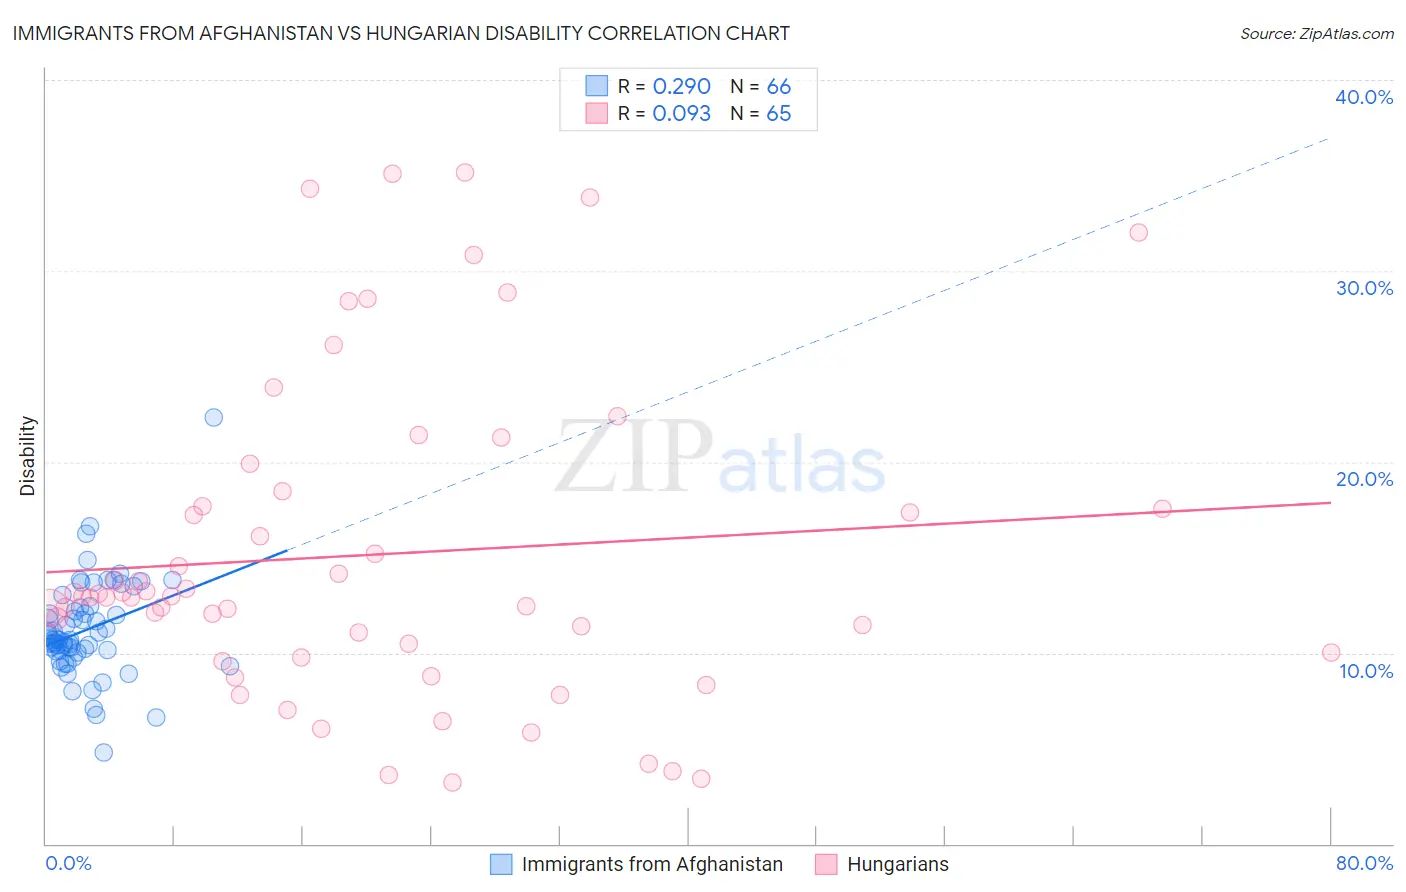
Immigrants from Afghanistan vs Hungarian Disability Correlation Chart
The statistical analysis conducted on geographies consisting of 147,638,051 people shows a weak positive correlation between the proportion of Immigrants from Afghanistan and percentage of population with a disability in the United States with a correlation coefficient (R) of 0.290 and weighted average of 11.0%. Similarly, the statistical analysis conducted on geographies consisting of 486,180,390 people shows a slight positive correlation between the proportion of Hungarians and percentage of population with a disability in the United States with a correlation coefficient (R) of 0.093 and weighted average of 12.2%, a difference of 11.2%.
Disability Correlation Summary
| Measurement | Immigrants from Afghanistan | Hungarian |
| Minimum | 4.8% | 3.2% |
| Maximum | 22.3% | 35.2% |
| Range | 17.5% | 31.9% |
| Mean | 11.2% | 15.1% |
| Median | 10.7% | 12.9% |
| Interquartile 25% (IQ1) | 10.1% | 9.9% |
| Interquartile 75% (IQ3) | 12.3% | 18.1% |
| Interquartile Range (IQR) | 2.3% | 8.2% |
| Standard Deviation (Sample) | 2.6% | 8.3% |
| Standard Deviation (Population) | 2.6% | 8.3% |
Similar Demographics by Disability
Demographics Similar to Immigrants from Afghanistan by Disability
In terms of disability, the demographic groups most similar to Immigrants from Afghanistan are Colombian (11.0%, a difference of 0.12%), Laotian (11.0%, a difference of 0.20%), Sri Lankan (11.0%, a difference of 0.21%), Bulgarian (11.0%, a difference of 0.22%), and Immigrants from Sweden (11.0%, a difference of 0.24%).
| Demographics | Rating | Rank | Disability |
| Immigrants | Bulgaria | 99.7 /100 | #61 | Exceptional 10.9% |
| Immigrants | Northern Africa | 99.7 /100 | #62 | Exceptional 10.9% |
| Immigrants | Eritrea | 99.7 /100 | #63 | Exceptional 11.0% |
| Immigrants | Sweden | 99.6 /100 | #64 | Exceptional 11.0% |
| Bulgarians | 99.6 /100 | #65 | Exceptional 11.0% |
| Laotians | 99.6 /100 | #66 | Exceptional 11.0% |
| Colombians | 99.6 /100 | #67 | Exceptional 11.0% |
| Immigrants | Afghanistan | 99.6 /100 | #68 | Exceptional 11.0% |
| Sri Lankans | 99.5 /100 | #69 | Exceptional 11.0% |
| Immigrants | France | 99.4 /100 | #70 | Exceptional 11.0% |
| Immigrants | Lebanon | 99.4 /100 | #71 | Exceptional 11.0% |
| Immigrants | Chile | 99.4 /100 | #72 | Exceptional 11.0% |
| Immigrants | Bangladesh | 99.4 /100 | #73 | Exceptional 11.0% |
| Immigrants | Serbia | 99.4 /100 | #74 | Exceptional 11.0% |
| Immigrants | Vietnam | 99.4 /100 | #75 | Exceptional 11.0% |
Demographics Similar to Hungarians by Disability
In terms of disability, the demographic groups most similar to Hungarians are Yugoslavian (12.2%, a difference of 0.0%), Polish (12.2%, a difference of 0.020%), Swedish (12.2%, a difference of 0.050%), Norwegian (12.2%, a difference of 0.090%), and British (12.2%, a difference of 0.11%).
| Demographics | Rating | Rank | Disability |
| Bahamians | 2.3 /100 | #233 | Tragic 12.2% |
| Japanese | 2.3 /100 | #234 | Tragic 12.2% |
| Yup'ik | 2.2 /100 | #235 | Tragic 12.2% |
| Chinese | 2.0 /100 | #236 | Tragic 12.2% |
| Immigrants | Congo | 1.9 /100 | #237 | Tragic 12.2% |
| Norwegians | 1.9 /100 | #238 | Tragic 12.2% |
| Swedes | 1.8 /100 | #239 | Tragic 12.2% |
| Hungarians | 1.7 /100 | #240 | Tragic 12.2% |
| Yugoslavians | 1.7 /100 | #241 | Tragic 12.2% |
| Poles | 1.7 /100 | #242 | Tragic 12.2% |
| British | 1.5 /100 | #243 | Tragic 12.2% |
| Basques | 1.5 /100 | #244 | Tragic 12.2% |
| Liberians | 1.5 /100 | #245 | Tragic 12.2% |
| Swiss | 1.5 /100 | #246 | Tragic 12.2% |
| Indonesians | 1.4 /100 | #247 | Tragic 12.2% |