French Canadian vs Alaskan Athabascan Disability
COMPARE
French Canadian
Alaskan Athabascan
Disability
Disability Comparison
French Canadians
Alaskan Athabascans
13.4%
DISABILITY
0.0/ 100
METRIC RATING
305th/ 347
METRIC RANK
14.4%
DISABILITY
0.0/ 100
METRIC RATING
331st/ 347
METRIC RANK
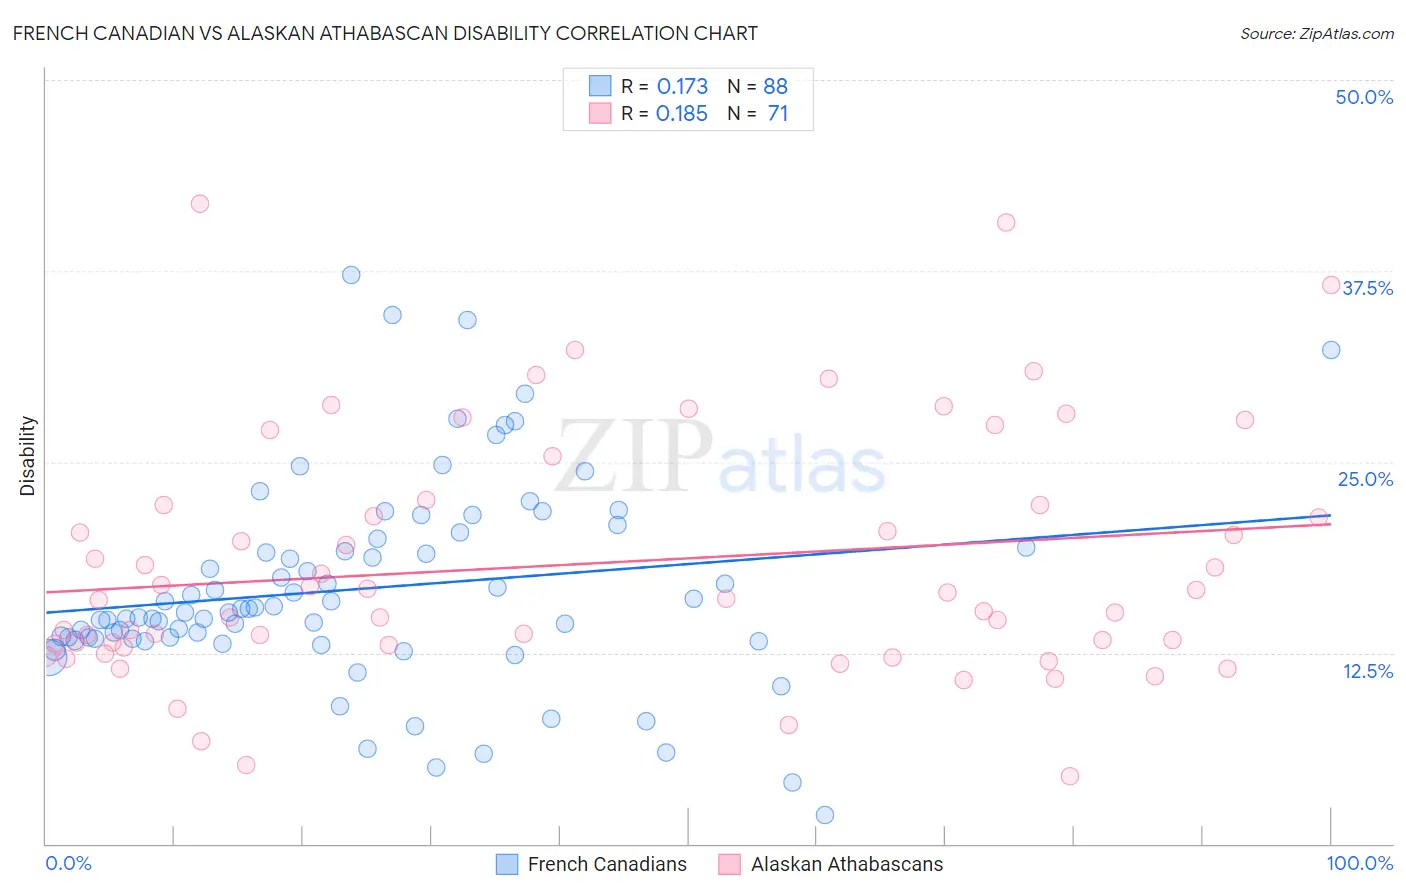
French Canadian vs Alaskan Athabascan Disability Correlation Chart
The statistical analysis conducted on geographies consisting of 502,588,623 people shows a poor positive correlation between the proportion of French Canadians and percentage of population with a disability in the United States with a correlation coefficient (R) of 0.173 and weighted average of 13.4%. Similarly, the statistical analysis conducted on geographies consisting of 45,821,092 people shows a poor positive correlation between the proportion of Alaskan Athabascans and percentage of population with a disability in the United States with a correlation coefficient (R) of 0.185 and weighted average of 14.4%, a difference of 7.6%.
Disability Correlation Summary
| Measurement | French Canadian | Alaskan Athabascan |
| Minimum | 1.9% | 4.4% |
| Maximum | 37.2% | 41.9% |
| Range | 35.3% | 37.5% |
| Mean | 16.7% | 18.3% |
| Median | 15.3% | 16.0% |
| Interquartile 25% (IQ1) | 13.4% | 13.0% |
| Interquartile 75% (IQ3) | 19.7% | 22.2% |
| Interquartile Range (IQR) | 6.3% | 9.2% |
| Standard Deviation (Sample) | 6.7% | 8.0% |
| Standard Deviation (Population) | 6.6% | 8.0% |
Similar Demographics by Disability
Demographics Similar to French Canadians by Disability
In terms of disability, the demographic groups most similar to French Canadians are Yakama (13.4%, a difference of 0.35%), Cape Verdean (13.5%, a difference of 0.61%), Shoshone (13.5%, a difference of 0.66%), French American Indian (13.5%, a difference of 0.75%), and Scotch-Irish (13.3%, a difference of 0.81%).
| Demographics | Rating | Rank | Disability |
| Alaska Natives | 0.0 /100 | #298 | Tragic 13.2% |
| French | 0.0 /100 | #299 | Tragic 13.2% |
| Pennsylvania Germans | 0.0 /100 | #300 | Tragic 13.2% |
| Immigrants | Micronesia | 0.0 /100 | #301 | Tragic 13.2% |
| Arapaho | 0.0 /100 | #302 | Tragic 13.2% |
| Scotch-Irish | 0.0 /100 | #303 | Tragic 13.3% |
| Yakama | 0.0 /100 | #304 | Tragic 13.4% |
| French Canadians | 0.0 /100 | #305 | Tragic 13.4% |
| Cape Verdeans | 0.0 /100 | #306 | Tragic 13.5% |
| Shoshone | 0.0 /100 | #307 | Tragic 13.5% |
| French American Indians | 0.0 /100 | #308 | Tragic 13.5% |
| Tlingit-Haida | 0.0 /100 | #309 | Tragic 13.5% |
| Blackfeet | 0.0 /100 | #310 | Tragic 13.6% |
| Delaware | 0.0 /100 | #311 | Tragic 13.6% |
| Spanish Americans | 0.0 /100 | #312 | Tragic 13.6% |
Demographics Similar to Alaskan Athabascans by Disability
In terms of disability, the demographic groups most similar to Alaskan Athabascans are Pueblo (14.4%, a difference of 0.020%), Cajun (14.6%, a difference of 1.1%), Yuman (14.6%, a difference of 1.2%), Navajo (14.3%, a difference of 1.3%), and Potawatomi (14.2%, a difference of 1.9%).
| Demographics | Rating | Rank | Disability |
| Chippewa | 0.0 /100 | #324 | Tragic 14.1% |
| Natives/Alaskans | 0.0 /100 | #325 | Tragic 14.2% |
| Osage | 0.0 /100 | #326 | Tragic 14.2% |
| Ottawa | 0.0 /100 | #327 | Tragic 14.2% |
| Immigrants | Azores | 0.0 /100 | #328 | Tragic 14.2% |
| Potawatomi | 0.0 /100 | #329 | Tragic 14.2% |
| Navajo | 0.0 /100 | #330 | Tragic 14.3% |
| Alaskan Athabascans | 0.0 /100 | #331 | Tragic 14.4% |
| Pueblo | 0.0 /100 | #332 | Tragic 14.4% |
| Cajuns | 0.0 /100 | #333 | Tragic 14.6% |
| Yuman | 0.0 /100 | #334 | Tragic 14.6% |
| Tohono O'odham | 0.0 /100 | #335 | Tragic 14.8% |
| Cherokee | 0.0 /100 | #336 | Tragic 14.8% |
| Seminole | 0.0 /100 | #337 | Tragic 14.9% |
| Dutch West Indians | 0.0 /100 | #338 | Tragic 14.9% |