Immigrants from Canada vs Alaskan Athabascan Disability
COMPARE
Immigrants from Canada
Alaskan Athabascan
Disability
Disability Comparison
Immigrants from Canada
Alaskan Athabascans
12.1%
DISABILITY
6.1/ 100
METRIC RATING
215th/ 347
METRIC RANK
14.4%
DISABILITY
0.0/ 100
METRIC RATING
331st/ 347
METRIC RANK
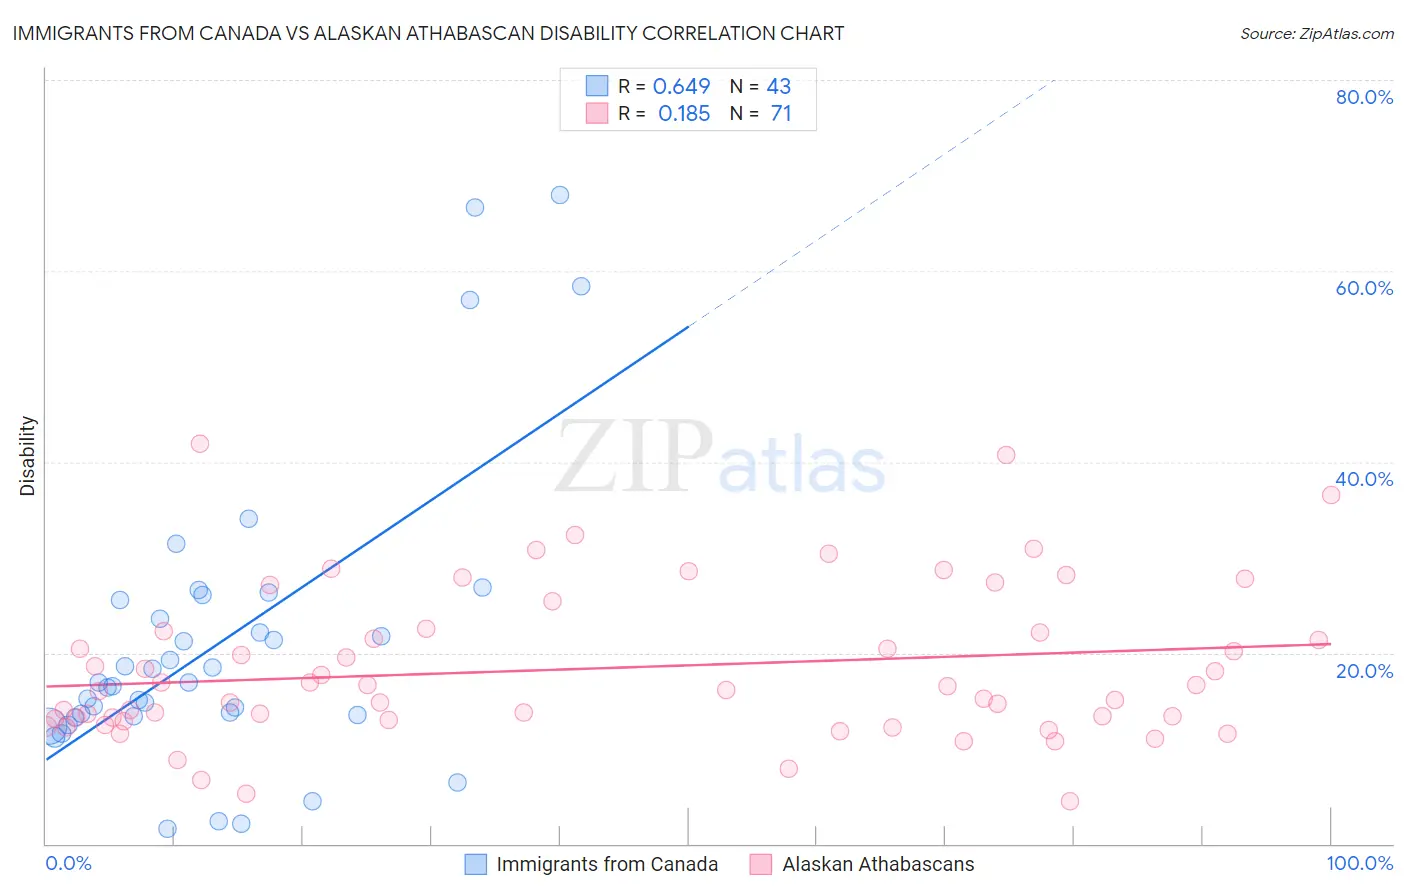
Immigrants from Canada vs Alaskan Athabascan Disability Correlation Chart
The statistical analysis conducted on geographies consisting of 459,374,446 people shows a significant positive correlation between the proportion of Immigrants from Canada and percentage of population with a disability in the United States with a correlation coefficient (R) of 0.649 and weighted average of 12.1%. Similarly, the statistical analysis conducted on geographies consisting of 45,821,092 people shows a poor positive correlation between the proportion of Alaskan Athabascans and percentage of population with a disability in the United States with a correlation coefficient (R) of 0.185 and weighted average of 14.4%, a difference of 19.8%.
Disability Correlation Summary
| Measurement | Immigrants from Canada | Alaskan Athabascan |
| Minimum | 1.6% | 4.4% |
| Maximum | 68.0% | 41.9% |
| Range | 66.4% | 37.5% |
| Mean | 21.0% | 18.3% |
| Median | 16.9% | 16.0% |
| Interquartile 25% (IQ1) | 13.3% | 13.0% |
| Interquartile 75% (IQ3) | 25.6% | 22.2% |
| Interquartile Range (IQR) | 12.2% | 9.2% |
| Standard Deviation (Sample) | 15.3% | 8.0% |
| Standard Deviation (Population) | 15.2% | 8.0% |
Similar Demographics by Disability
Demographics Similar to Immigrants from Canada by Disability
In terms of disability, the demographic groups most similar to Immigrants from Canada are Immigrants from Somalia (12.0%, a difference of 0.13%), Panamanian (12.1%, a difference of 0.15%), Immigrants from North America (12.1%, a difference of 0.16%), Austrian (12.0%, a difference of 0.18%), and Immigrants from Iraq (12.0%, a difference of 0.18%).
| Demographics | Rating | Rank | Disability |
| Immigrants | Caribbean | 9.1 /100 | #208 | Tragic 12.0% |
| Danes | 8.7 /100 | #209 | Tragic 12.0% |
| Czechs | 7.9 /100 | #210 | Tragic 12.0% |
| Immigrants | Cambodia | 7.3 /100 | #211 | Tragic 12.0% |
| Austrians | 7.2 /100 | #212 | Tragic 12.0% |
| Immigrants | Iraq | 7.1 /100 | #213 | Tragic 12.0% |
| Immigrants | Somalia | 6.8 /100 | #214 | Tragic 12.0% |
| Immigrants | Canada | 6.1 /100 | #215 | Tragic 12.1% |
| Panamanians | 5.4 /100 | #216 | Tragic 12.1% |
| Immigrants | North America | 5.3 /100 | #217 | Tragic 12.1% |
| Immigrants | Jamaica | 5.0 /100 | #218 | Tragic 12.1% |
| Croatians | 4.9 /100 | #219 | Tragic 12.1% |
| Immigrants | Bahamas | 4.7 /100 | #220 | Tragic 12.1% |
| Northern Europeans | 4.2 /100 | #221 | Tragic 12.1% |
| Spanish American Indians | 4.1 /100 | #222 | Tragic 12.1% |
Demographics Similar to Alaskan Athabascans by Disability
In terms of disability, the demographic groups most similar to Alaskan Athabascans are Pueblo (14.4%, a difference of 0.020%), Cajun (14.6%, a difference of 1.1%), Yuman (14.6%, a difference of 1.2%), Navajo (14.3%, a difference of 1.3%), and Potawatomi (14.2%, a difference of 1.9%).
| Demographics | Rating | Rank | Disability |
| Chippewa | 0.0 /100 | #324 | Tragic 14.1% |
| Natives/Alaskans | 0.0 /100 | #325 | Tragic 14.2% |
| Osage | 0.0 /100 | #326 | Tragic 14.2% |
| Ottawa | 0.0 /100 | #327 | Tragic 14.2% |
| Immigrants | Azores | 0.0 /100 | #328 | Tragic 14.2% |
| Potawatomi | 0.0 /100 | #329 | Tragic 14.2% |
| Navajo | 0.0 /100 | #330 | Tragic 14.3% |
| Alaskan Athabascans | 0.0 /100 | #331 | Tragic 14.4% |
| Pueblo | 0.0 /100 | #332 | Tragic 14.4% |
| Cajuns | 0.0 /100 | #333 | Tragic 14.6% |
| Yuman | 0.0 /100 | #334 | Tragic 14.6% |
| Tohono O'odham | 0.0 /100 | #335 | Tragic 14.8% |
| Cherokee | 0.0 /100 | #336 | Tragic 14.8% |
| Seminole | 0.0 /100 | #337 | Tragic 14.9% |
| Dutch West Indians | 0.0 /100 | #338 | Tragic 14.9% |