Immigrants from Afghanistan vs Greek Disability
COMPARE
Immigrants from Afghanistan
Greek
Disability
Disability Comparison
Immigrants from Afghanistan
Greeks
11.0%
DISABILITY
99.6/ 100
METRIC RATING
68th/ 347
METRIC RANK
11.7%
DISABILITY
46.2/ 100
METRIC RATING
178th/ 347
METRIC RANK
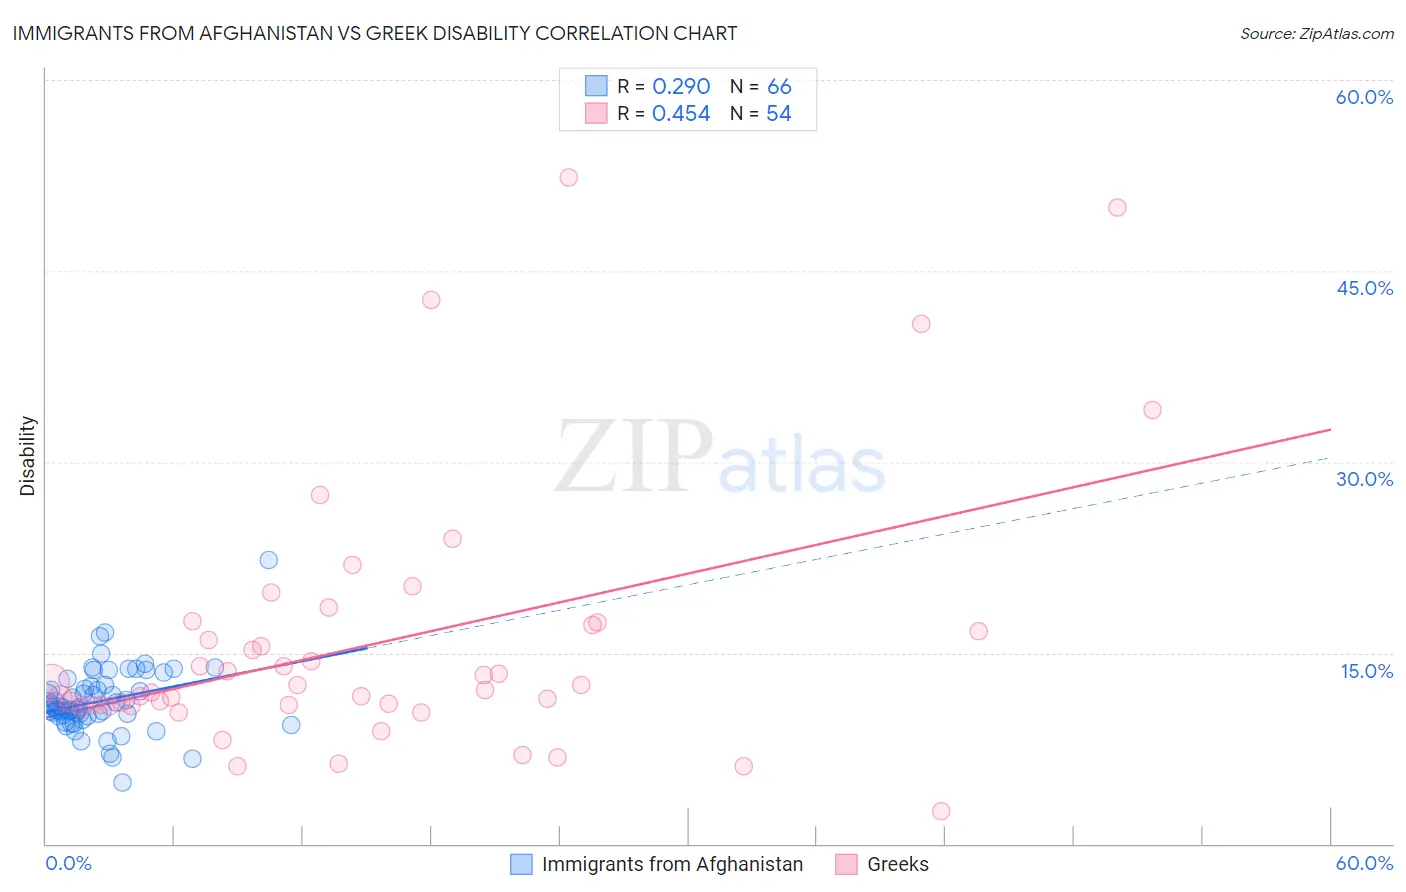
Immigrants from Afghanistan vs Greek Disability Correlation Chart
The statistical analysis conducted on geographies consisting of 147,638,051 people shows a weak positive correlation between the proportion of Immigrants from Afghanistan and percentage of population with a disability in the United States with a correlation coefficient (R) of 0.290 and weighted average of 11.0%. Similarly, the statistical analysis conducted on geographies consisting of 482,714,083 people shows a moderate positive correlation between the proportion of Greeks and percentage of population with a disability in the United States with a correlation coefficient (R) of 0.454 and weighted average of 11.7%, a difference of 6.6%.
Disability Correlation Summary
| Measurement | Immigrants from Afghanistan | Greek |
| Minimum | 4.8% | 2.5% |
| Maximum | 22.3% | 52.3% |
| Range | 17.5% | 49.8% |
| Mean | 11.2% | 15.7% |
| Median | 10.7% | 12.2% |
| Interquartile 25% (IQ1) | 10.1% | 10.9% |
| Interquartile 75% (IQ3) | 12.3% | 17.2% |
| Interquartile Range (IQR) | 2.3% | 6.3% |
| Standard Deviation (Sample) | 2.6% | 10.4% |
| Standard Deviation (Population) | 2.6% | 10.3% |
Similar Demographics by Disability
Demographics Similar to Immigrants from Afghanistan by Disability
In terms of disability, the demographic groups most similar to Immigrants from Afghanistan are Colombian (11.0%, a difference of 0.12%), Laotian (11.0%, a difference of 0.20%), Sri Lankan (11.0%, a difference of 0.21%), Bulgarian (11.0%, a difference of 0.22%), and Immigrants from Sweden (11.0%, a difference of 0.24%).
| Demographics | Rating | Rank | Disability |
| Immigrants | Bulgaria | 99.7 /100 | #61 | Exceptional 10.9% |
| Immigrants | Northern Africa | 99.7 /100 | #62 | Exceptional 10.9% |
| Immigrants | Eritrea | 99.7 /100 | #63 | Exceptional 11.0% |
| Immigrants | Sweden | 99.6 /100 | #64 | Exceptional 11.0% |
| Bulgarians | 99.6 /100 | #65 | Exceptional 11.0% |
| Laotians | 99.6 /100 | #66 | Exceptional 11.0% |
| Colombians | 99.6 /100 | #67 | Exceptional 11.0% |
| Immigrants | Afghanistan | 99.6 /100 | #68 | Exceptional 11.0% |
| Sri Lankans | 99.5 /100 | #69 | Exceptional 11.0% |
| Immigrants | France | 99.4 /100 | #70 | Exceptional 11.0% |
| Immigrants | Lebanon | 99.4 /100 | #71 | Exceptional 11.0% |
| Immigrants | Chile | 99.4 /100 | #72 | Exceptional 11.0% |
| Immigrants | Bangladesh | 99.4 /100 | #73 | Exceptional 11.0% |
| Immigrants | Serbia | 99.4 /100 | #74 | Exceptional 11.0% |
| Immigrants | Vietnam | 99.4 /100 | #75 | Exceptional 11.0% |
Demographics Similar to Greeks by Disability
In terms of disability, the demographic groups most similar to Greeks are Immigrants from Central America (11.7%, a difference of 0.020%), Immigrants from Western Africa (11.7%, a difference of 0.060%), Haitian (11.7%, a difference of 0.11%), Albanian (11.7%, a difference of 0.17%), and Immigrants from Armenia (11.7%, a difference of 0.19%).
| Demographics | Rating | Rank | Disability |
| Immigrants | Southern Europe | 52.8 /100 | #171 | Average 11.7% |
| Trinidadians and Tobagonians | 52.7 /100 | #172 | Average 11.7% |
| Maltese | 50.6 /100 | #173 | Average 11.7% |
| Albanians | 50.0 /100 | #174 | Average 11.7% |
| Haitians | 48.6 /100 | #175 | Average 11.7% |
| Immigrants | Western Africa | 47.5 /100 | #176 | Average 11.7% |
| Immigrants | Central America | 46.6 /100 | #177 | Average 11.7% |
| Greeks | 46.2 /100 | #178 | Average 11.7% |
| Immigrants | Armenia | 41.9 /100 | #179 | Average 11.7% |
| Immigrants | Honduras | 37.8 /100 | #180 | Fair 11.8% |
| Immigrants | Oceania | 34.3 /100 | #181 | Fair 11.8% |
| Icelanders | 34.0 /100 | #182 | Fair 11.8% |
| Hondurans | 31.2 /100 | #183 | Fair 11.8% |
| Iraqis | 30.0 /100 | #184 | Fair 11.8% |
| Immigrants | Burma/Myanmar | 28.5 /100 | #185 | Fair 11.8% |