Immigrants from Afghanistan vs Pima Disability
COMPARE
Immigrants from Afghanistan
Pima
Disability
Disability Comparison
Immigrants from Afghanistan
Pima
11.0%
DISABILITY
99.6/ 100
METRIC RATING
68th/ 347
METRIC RANK
13.7%
DISABILITY
0.0/ 100
METRIC RATING
316th/ 347
METRIC RANK
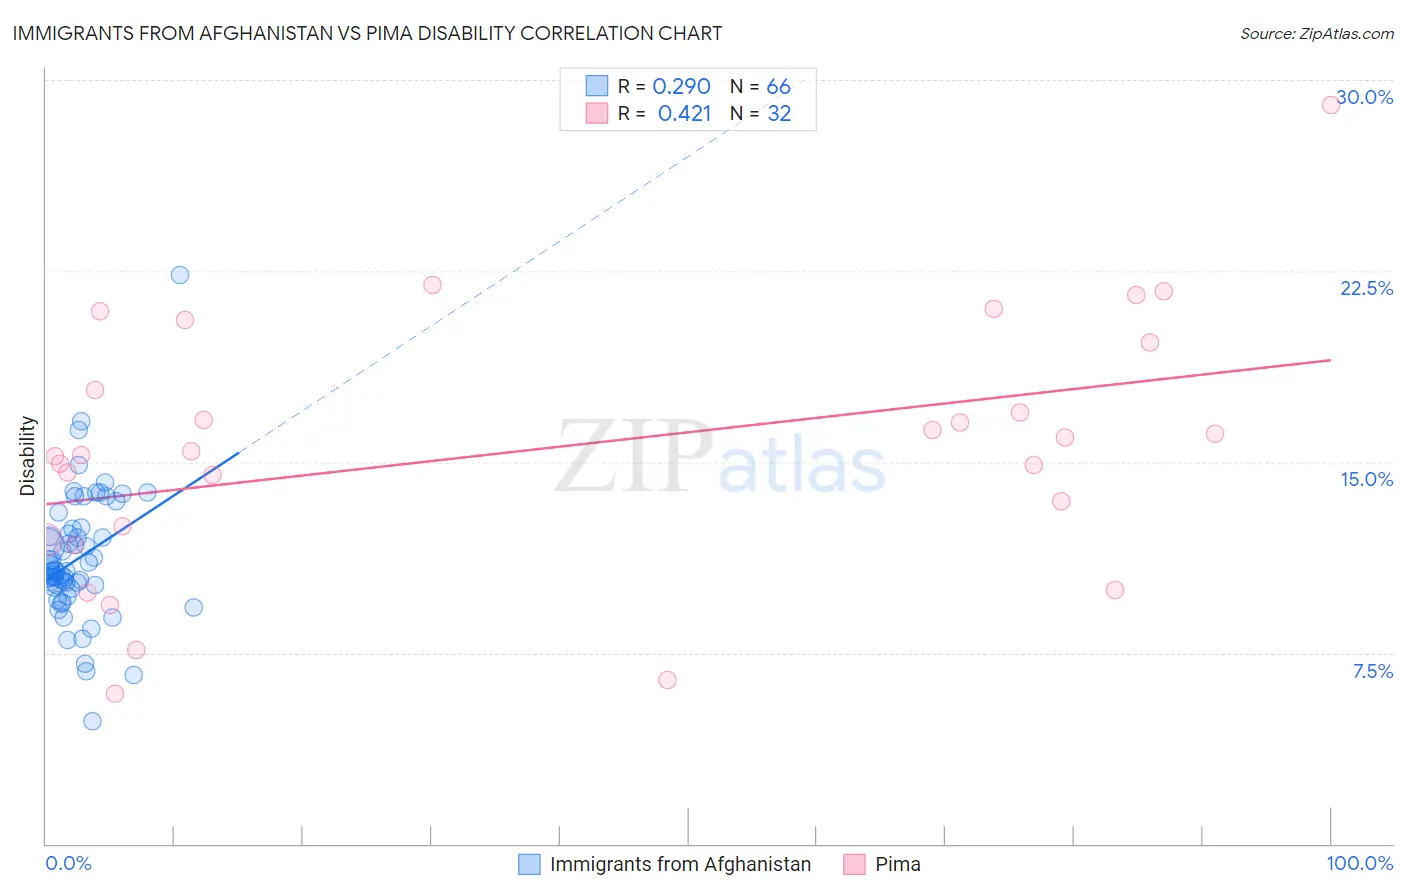
Immigrants from Afghanistan vs Pima Disability Correlation Chart
The statistical analysis conducted on geographies consisting of 147,638,051 people shows a weak positive correlation between the proportion of Immigrants from Afghanistan and percentage of population with a disability in the United States with a correlation coefficient (R) of 0.290 and weighted average of 11.0%. Similarly, the statistical analysis conducted on geographies consisting of 61,542,416 people shows a moderate positive correlation between the proportion of Pima and percentage of population with a disability in the United States with a correlation coefficient (R) of 0.421 and weighted average of 13.7%, a difference of 24.6%.
Disability Correlation Summary
| Measurement | Immigrants from Afghanistan | Pima |
| Minimum | 4.8% | 5.9% |
| Maximum | 22.3% | 29.0% |
| Range | 17.5% | 23.1% |
| Mean | 11.2% | 15.5% |
| Median | 10.7% | 15.3% |
| Interquartile 25% (IQ1) | 10.1% | 12.2% |
| Interquartile 75% (IQ3) | 12.3% | 18.7% |
| Interquartile Range (IQR) | 2.3% | 6.5% |
| Standard Deviation (Sample) | 2.6% | 5.1% |
| Standard Deviation (Population) | 2.6% | 5.0% |
Similar Demographics by Disability
Demographics Similar to Immigrants from Afghanistan by Disability
In terms of disability, the demographic groups most similar to Immigrants from Afghanistan are Colombian (11.0%, a difference of 0.12%), Laotian (11.0%, a difference of 0.20%), Sri Lankan (11.0%, a difference of 0.21%), Bulgarian (11.0%, a difference of 0.22%), and Immigrants from Sweden (11.0%, a difference of 0.24%).
| Demographics | Rating | Rank | Disability |
| Immigrants | Bulgaria | 99.7 /100 | #61 | Exceptional 10.9% |
| Immigrants | Northern Africa | 99.7 /100 | #62 | Exceptional 10.9% |
| Immigrants | Eritrea | 99.7 /100 | #63 | Exceptional 11.0% |
| Immigrants | Sweden | 99.6 /100 | #64 | Exceptional 11.0% |
| Bulgarians | 99.6 /100 | #65 | Exceptional 11.0% |
| Laotians | 99.6 /100 | #66 | Exceptional 11.0% |
| Colombians | 99.6 /100 | #67 | Exceptional 11.0% |
| Immigrants | Afghanistan | 99.6 /100 | #68 | Exceptional 11.0% |
| Sri Lankans | 99.5 /100 | #69 | Exceptional 11.0% |
| Immigrants | France | 99.4 /100 | #70 | Exceptional 11.0% |
| Immigrants | Lebanon | 99.4 /100 | #71 | Exceptional 11.0% |
| Immigrants | Chile | 99.4 /100 | #72 | Exceptional 11.0% |
| Immigrants | Bangladesh | 99.4 /100 | #73 | Exceptional 11.0% |
| Immigrants | Serbia | 99.4 /100 | #74 | Exceptional 11.0% |
| Immigrants | Vietnam | 99.4 /100 | #75 | Exceptional 11.0% |
Demographics Similar to Pima by Disability
In terms of disability, the demographic groups most similar to Pima are Immigrants from Cabo Verde (13.7%, a difference of 0.0%), Black/African American (13.7%, a difference of 0.030%), Puget Sound Salish (13.7%, a difference of 0.030%), Cree (13.7%, a difference of 0.070%), and Spanish American (13.6%, a difference of 0.42%).
| Demographics | Rating | Rank | Disability |
| Tlingit-Haida | 0.0 /100 | #309 | Tragic 13.5% |
| Blackfeet | 0.0 /100 | #310 | Tragic 13.6% |
| Delaware | 0.0 /100 | #311 | Tragic 13.6% |
| Spanish Americans | 0.0 /100 | #312 | Tragic 13.6% |
| Cree | 0.0 /100 | #313 | Tragic 13.7% |
| Blacks/African Americans | 0.0 /100 | #314 | Tragic 13.7% |
| Puget Sound Salish | 0.0 /100 | #315 | Tragic 13.7% |
| Pima | 0.0 /100 | #316 | Tragic 13.7% |
| Immigrants | Cabo Verde | 0.0 /100 | #317 | Tragic 13.7% |
| Menominee | 0.0 /100 | #318 | Tragic 13.8% |
| Iroquois | 0.0 /100 | #319 | Tragic 13.8% |
| Apache | 0.0 /100 | #320 | Tragic 13.9% |
| Paiute | 0.0 /100 | #321 | Tragic 13.9% |
| Americans | 0.0 /100 | #322 | Tragic 13.9% |
| Comanche | 0.0 /100 | #323 | Tragic 14.1% |