Nepalese vs Immigrants from Czechoslovakia Disability Age 5 to 17
COMPARE
Nepalese
Immigrants from Czechoslovakia
Disability Age 5 to 17
Disability Age 5 to 17 Comparison
Nepalese
Immigrants from Czechoslovakia
5.3%
DISABILITY AGE 5 TO 17
98.7/ 100
METRIC RATING
100th/ 347
METRIC RANK
5.2%
DISABILITY AGE 5 TO 17
99.7/ 100
METRIC RATING
73rd/ 347
METRIC RANK
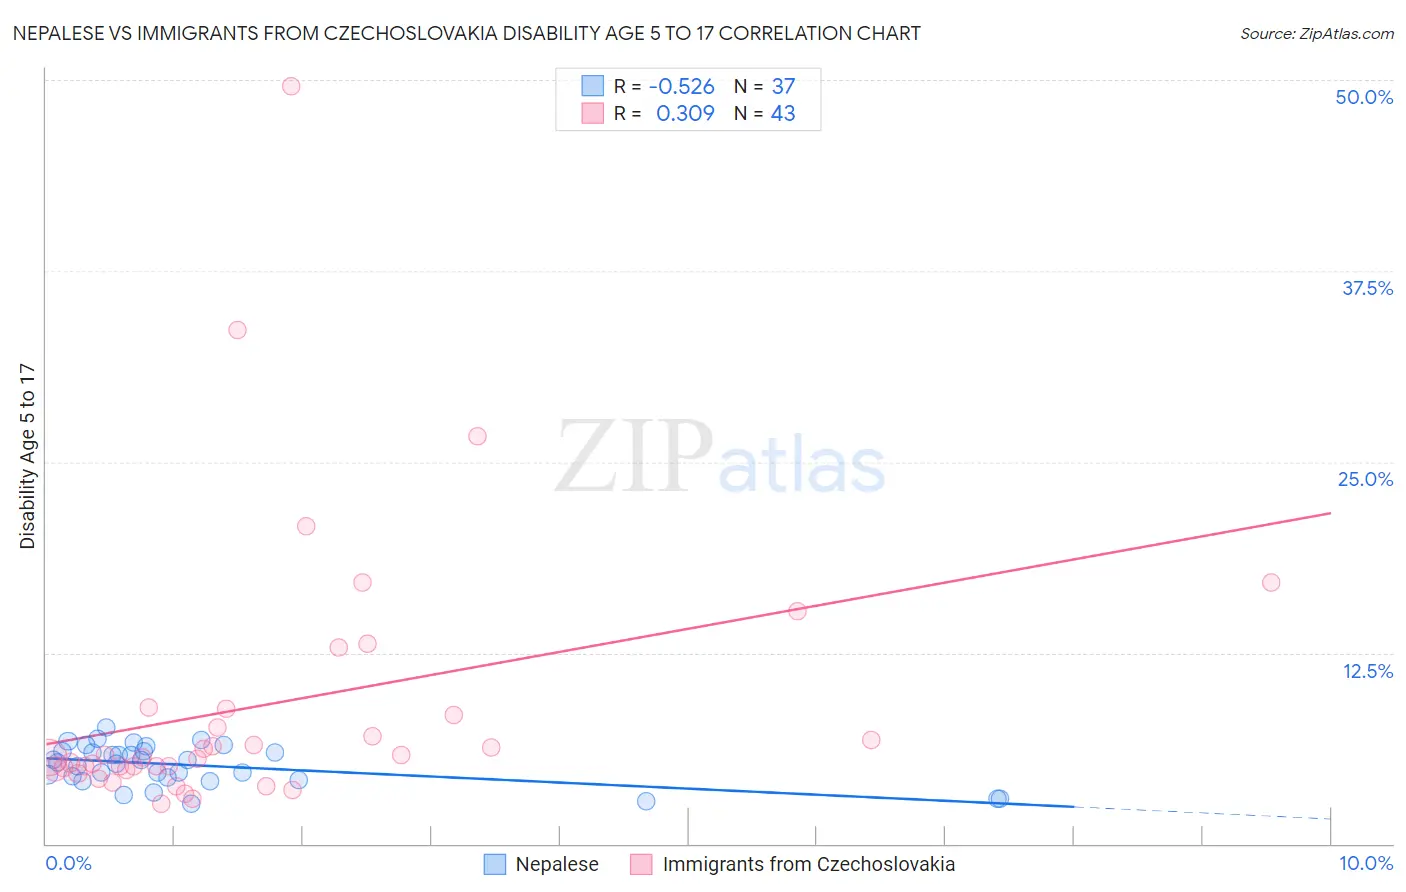
Nepalese vs Immigrants from Czechoslovakia Disability Age 5 to 17 Correlation Chart
The statistical analysis conducted on geographies consisting of 24,514,017 people shows a substantial negative correlation between the proportion of Nepalese and percentage of population with a disability between the ages 5 and 17 in the United States with a correlation coefficient (R) of -0.526 and weighted average of 5.3%. Similarly, the statistical analysis conducted on geographies consisting of 194,293,746 people shows a mild positive correlation between the proportion of Immigrants from Czechoslovakia and percentage of population with a disability between the ages 5 and 17 in the United States with a correlation coefficient (R) of 0.309 and weighted average of 5.2%, a difference of 1.9%.
Disability Age 5 to 17 Correlation Summary
| Measurement | Nepalese | Immigrants from Czechoslovakia |
| Minimum | 2.7% | 2.6% |
| Maximum | 7.6% | 49.6% |
| Range | 4.9% | 47.0% |
| Mean | 5.1% | 9.1% |
| Median | 5.3% | 5.7% |
| Interquartile 25% (IQ1) | 4.2% | 4.9% |
| Interquartile 75% (IQ3) | 6.0% | 8.8% |
| Interquartile Range (IQR) | 1.8% | 4.0% |
| Standard Deviation (Sample) | 1.3% | 9.0% |
| Standard Deviation (Population) | 1.3% | 8.9% |
Similar Demographics by Disability Age 5 to 17
Demographics Similar to Nepalese by Disability Age 5 to 17
In terms of disability age 5 to 17, the demographic groups most similar to Nepalese are Menominee (5.3%, a difference of 0.020%), Nicaraguan (5.3%, a difference of 0.10%), Salvadoran (5.3%, a difference of 0.13%), Cambodian (5.3%, a difference of 0.16%), and Peruvian (5.3%, a difference of 0.20%).
| Demographics | Rating | Rank | Disability Age 5 to 17 |
| Immigrants | Peru | 99.1 /100 | #93 | Exceptional 5.3% |
| Immigrants | Jordan | 99.1 /100 | #94 | Exceptional 5.3% |
| Immigrants | Grenada | 99.1 /100 | #95 | Exceptional 5.3% |
| Immigrants | El Salvador | 99.0 /100 | #96 | Exceptional 5.3% |
| Immigrants | Europe | 99.0 /100 | #97 | Exceptional 5.3% |
| Immigrants | Austria | 98.9 /100 | #98 | Exceptional 5.3% |
| Cambodians | 98.8 /100 | #99 | Exceptional 5.3% |
| Nepalese | 98.7 /100 | #100 | Exceptional 5.3% |
| Menominee | 98.7 /100 | #101 | Exceptional 5.3% |
| Nicaraguans | 98.6 /100 | #102 | Exceptional 5.3% |
| Salvadorans | 98.6 /100 | #103 | Exceptional 5.3% |
| Peruvians | 98.5 /100 | #104 | Exceptional 5.3% |
| Immigrants | Italy | 98.4 /100 | #105 | Exceptional 5.3% |
| Immigrants | Yemen | 98.2 /100 | #106 | Exceptional 5.3% |
| Russians | 98.2 /100 | #107 | Exceptional 5.3% |
Demographics Similar to Immigrants from Czechoslovakia by Disability Age 5 to 17
In terms of disability age 5 to 17, the demographic groups most similar to Immigrants from Czechoslovakia are Immigrants from Vietnam (5.2%, a difference of 0.020%), Jordanian (5.2%, a difference of 0.050%), Immigrants from Romania (5.2%, a difference of 0.070%), Immigrants from Belgium (5.2%, a difference of 0.090%), and Guyanese (5.2%, a difference of 0.13%).
| Demographics | Rating | Rank | Disability Age 5 to 17 |
| Palestinians | 99.8 /100 | #66 | Exceptional 5.2% |
| Macedonians | 99.8 /100 | #67 | Exceptional 5.2% |
| Immigrants | Syria | 99.7 /100 | #68 | Exceptional 5.2% |
| Guyanese | 99.7 /100 | #69 | Exceptional 5.2% |
| Immigrants | Belgium | 99.7 /100 | #70 | Exceptional 5.2% |
| Jordanians | 99.7 /100 | #71 | Exceptional 5.2% |
| Immigrants | Vietnam | 99.7 /100 | #72 | Exceptional 5.2% |
| Immigrants | Czechoslovakia | 99.7 /100 | #73 | Exceptional 5.2% |
| Immigrants | Romania | 99.7 /100 | #74 | Exceptional 5.2% |
| Immigrants | Moldova | 99.6 /100 | #75 | Exceptional 5.2% |
| Immigrants | Guyana | 99.6 /100 | #76 | Exceptional 5.2% |
| Immigrants | Kazakhstan | 99.6 /100 | #77 | Exceptional 5.2% |
| Immigrants | Cuba | 99.6 /100 | #78 | Exceptional 5.2% |
| Afghans | 99.6 /100 | #79 | Exceptional 5.2% |
| Sri Lankans | 99.6 /100 | #80 | Exceptional 5.2% |