Icelander vs Immigrants from Czechoslovakia Householder Income Under 25 years
COMPARE
Icelander
Immigrants from Czechoslovakia
Householder Income Under 25 years
Householder Income Under 25 years Comparison
Icelanders
Immigrants from Czechoslovakia
$51,247
HOUSEHOLDER INCOME UNDER 25 YEARS
9.1/ 100
METRIC RATING
215th/ 347
METRIC RANK
$54,352
HOUSEHOLDER INCOME UNDER 25 YEARS
99.5/ 100
METRIC RATING
85th/ 347
METRIC RANK
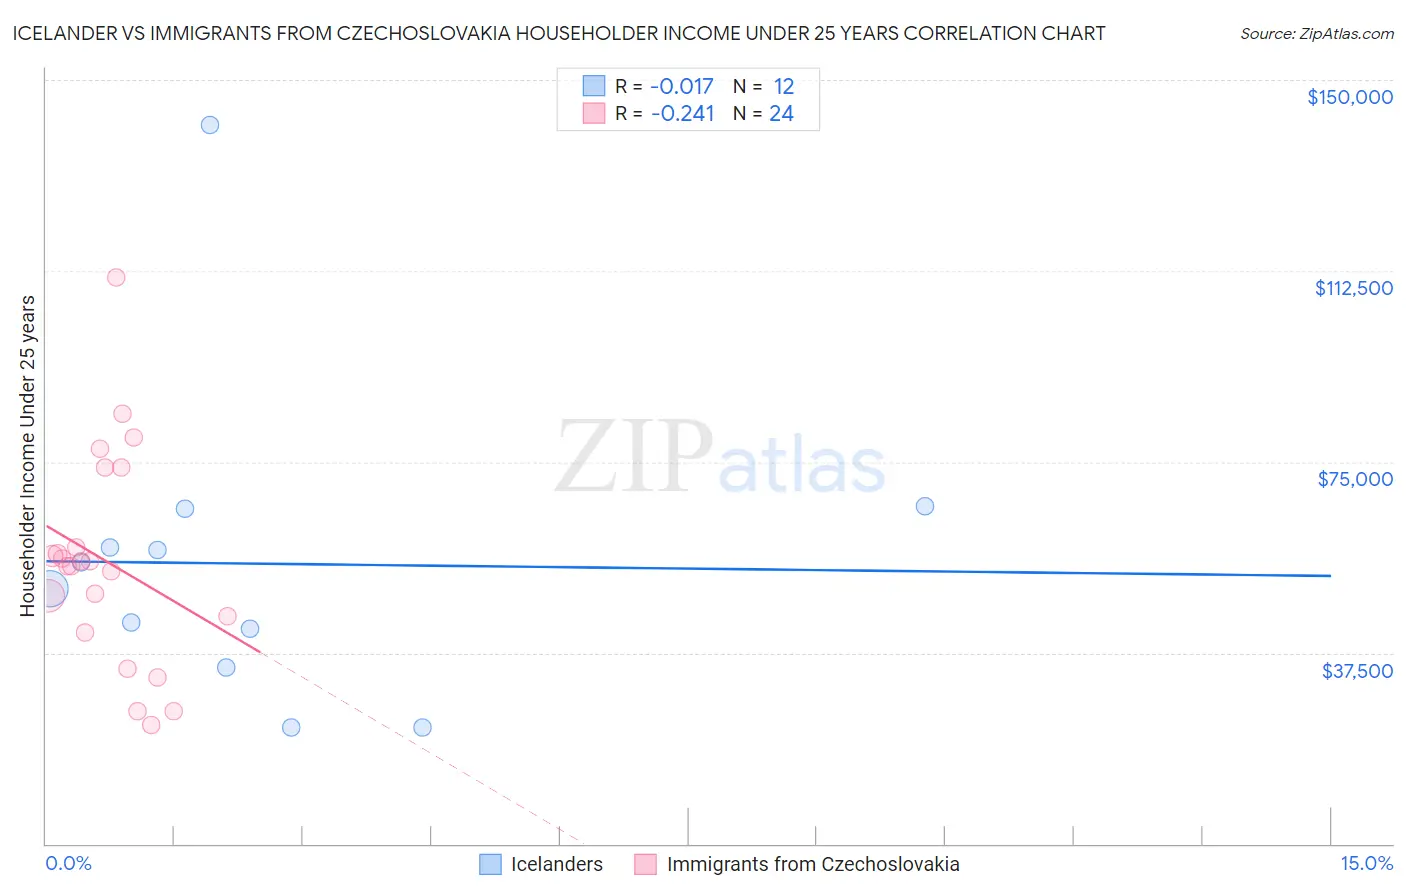
Icelander vs Immigrants from Czechoslovakia Householder Income Under 25 years Correlation Chart
The statistical analysis conducted on geographies consisting of 147,067,762 people shows no correlation between the proportion of Icelanders and household income with householder under the age of 25 in the United States with a correlation coefficient (R) of -0.017 and weighted average of $51,247. Similarly, the statistical analysis conducted on geographies consisting of 171,200,377 people shows a weak negative correlation between the proportion of Immigrants from Czechoslovakia and household income with householder under the age of 25 in the United States with a correlation coefficient (R) of -0.241 and weighted average of $54,352, a difference of 6.1%.
Householder Income Under 25 years Correlation Summary
| Measurement | Icelander | Immigrants from Czechoslovakia |
| Minimum | $22,794 | $23,355 |
| Maximum | $141,236 | $111,159 |
| Range | $118,442 | $87,804 |
| Mean | $55,024 | $55,385 |
| Median | $52,703 | $55,099 |
| Interquartile 25% (IQ1) | $38,302 | $43,094 |
| Interquartile 75% (IQ3) | $62,047 | $66,086 |
| Interquartile Range (IQR) | $23,745 | $22,993 |
| Standard Deviation (Sample) | $30,921 | $20,684 |
| Standard Deviation (Population) | $29,605 | $20,249 |
Similar Demographics by Householder Income Under 25 years
Demographics Similar to Icelanders by Householder Income Under 25 years
In terms of householder income under 25 years, the demographic groups most similar to Icelanders are Zimbabwean ($51,259, a difference of 0.020%), Dutch ($51,265, a difference of 0.030%), French ($51,230, a difference of 0.030%), Czechoslovakian ($51,224, a difference of 0.050%), and Immigrants from Belize ($51,223, a difference of 0.050%).
| Demographics | Rating | Rank | Householder Income Under 25 years |
| Immigrants | Jordan | 11.9 /100 | #208 | Poor $51,370 |
| Syrians | 11.4 /100 | #209 | Poor $51,353 |
| Immigrants | Ghana | 10.9 /100 | #210 | Poor $51,333 |
| Irish | 10.6 /100 | #211 | Poor $51,317 |
| Immigrants | Panama | 9.7 /100 | #212 | Tragic $51,278 |
| Dutch | 9.4 /100 | #213 | Tragic $51,265 |
| Zimbabweans | 9.3 /100 | #214 | Tragic $51,259 |
| Icelanders | 9.1 /100 | #215 | Tragic $51,247 |
| French | 8.7 /100 | #216 | Tragic $51,230 |
| Czechoslovakians | 8.6 /100 | #217 | Tragic $51,224 |
| Immigrants | Belize | 8.6 /100 | #218 | Tragic $51,223 |
| Arabs | 8.5 /100 | #219 | Tragic $51,219 |
| Immigrants | Germany | 8.0 /100 | #220 | Tragic $51,190 |
| Immigrants | Eastern Africa | 7.4 /100 | #221 | Tragic $51,158 |
| Spaniards | 6.8 /100 | #222 | Tragic $51,117 |
Demographics Similar to Immigrants from Czechoslovakia by Householder Income Under 25 years
In terms of householder income under 25 years, the demographic groups most similar to Immigrants from Czechoslovakia are Bulgarian ($54,352, a difference of 0.0%), Immigrants from Croatia ($54,343, a difference of 0.020%), Laotian ($54,369, a difference of 0.030%), Brazilian ($54,335, a difference of 0.030%), and Yakama ($54,321, a difference of 0.060%).
| Demographics | Rating | Rank | Householder Income Under 25 years |
| Nepalese | 99.6 /100 | #78 | Exceptional $54,472 |
| Immigrants | Italy | 99.6 /100 | #79 | Exceptional $54,449 |
| Egyptians | 99.6 /100 | #80 | Exceptional $54,444 |
| Portuguese | 99.6 /100 | #81 | Exceptional $54,436 |
| Russians | 99.5 /100 | #82 | Exceptional $54,389 |
| Laotians | 99.5 /100 | #83 | Exceptional $54,369 |
| Bulgarians | 99.5 /100 | #84 | Exceptional $54,352 |
| Immigrants | Czechoslovakia | 99.5 /100 | #85 | Exceptional $54,352 |
| Immigrants | Croatia | 99.5 /100 | #86 | Exceptional $54,343 |
| Brazilians | 99.5 /100 | #87 | Exceptional $54,335 |
| Yakama | 99.5 /100 | #88 | Exceptional $54,321 |
| Immigrants | South America | 99.4 /100 | #89 | Exceptional $54,268 |
| Turks | 99.4 /100 | #90 | Exceptional $54,266 |
| Immigrants | Egypt | 99.3 /100 | #91 | Exceptional $54,239 |
| Immigrants | St. Vincent and the Grenadines | 99.3 /100 | #92 | Exceptional $54,230 |