English vs Immigrants from Nigeria Disability Age 5 to 17
COMPARE
English
Immigrants from Nigeria
Disability Age 5 to 17
Disability Age 5 to 17 Comparison
English
Immigrants from Nigeria
6.2%
DISABILITY AGE 5 TO 17
0.0/ 100
METRIC RATING
285th/ 347
METRIC RANK
5.7%
DISABILITY AGE 5 TO 17
23.4/ 100
METRIC RATING
195th/ 347
METRIC RANK
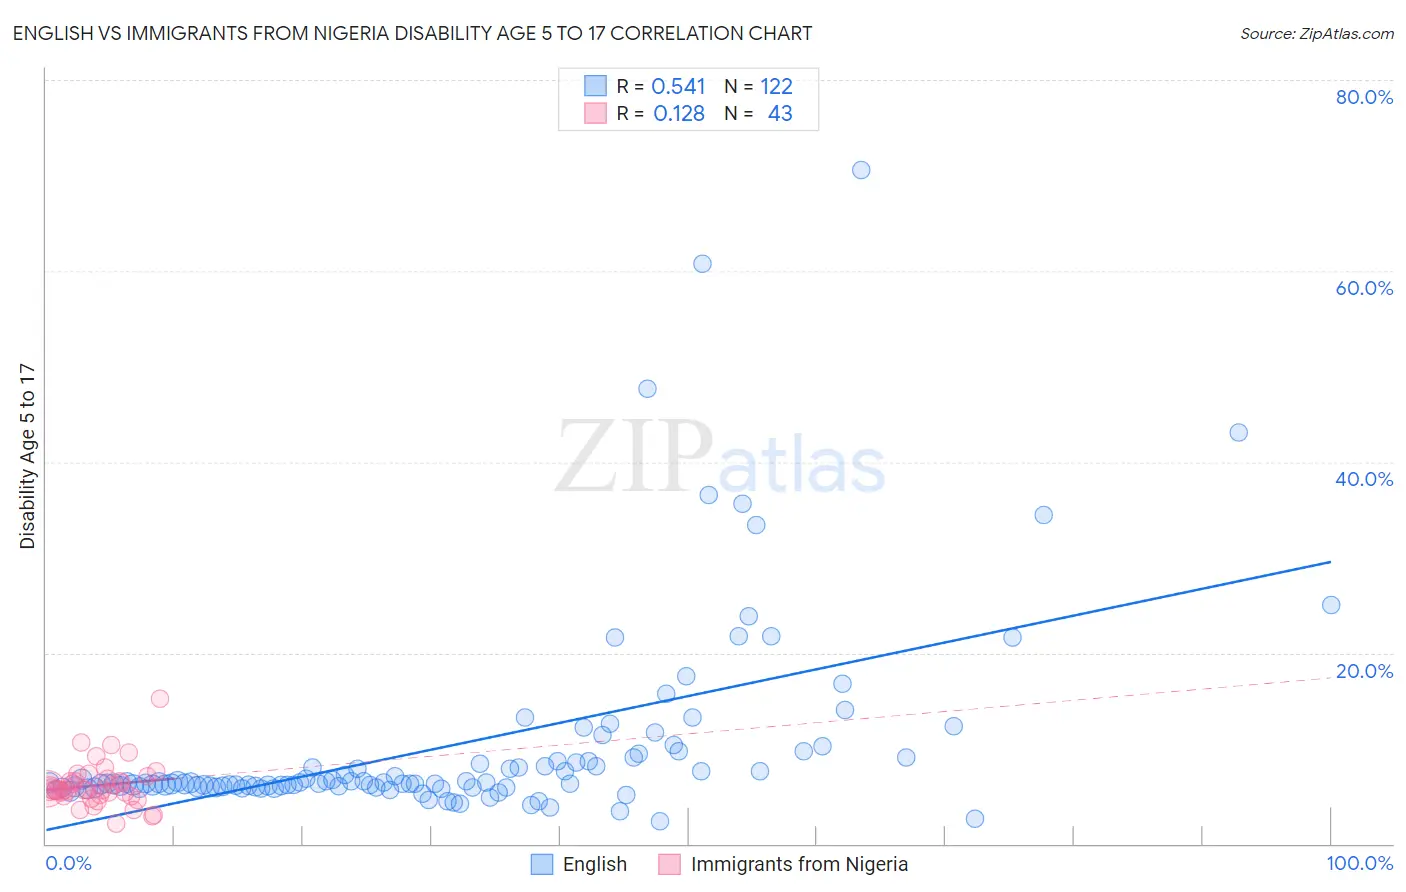
English vs Immigrants from Nigeria Disability Age 5 to 17 Correlation Chart
The statistical analysis conducted on geographies consisting of 563,308,437 people shows a substantial positive correlation between the proportion of English and percentage of population with a disability between the ages 5 and 17 in the United States with a correlation coefficient (R) of 0.541 and weighted average of 6.2%. Similarly, the statistical analysis conducted on geographies consisting of 282,146,479 people shows a poor positive correlation between the proportion of Immigrants from Nigeria and percentage of population with a disability between the ages 5 and 17 in the United States with a correlation coefficient (R) of 0.128 and weighted average of 5.7%, a difference of 8.4%.
Disability Age 5 to 17 Correlation Summary
| Measurement | English | Immigrants from Nigeria |
| Minimum | 2.4% | 2.1% |
| Maximum | 70.5% | 15.2% |
| Range | 68.2% | 13.1% |
| Mean | 10.4% | 6.1% |
| Median | 6.4% | 5.6% |
| Interquartile 25% (IQ1) | 6.0% | 5.0% |
| Interquartile 75% (IQ3) | 9.1% | 6.8% |
| Interquartile Range (IQR) | 3.1% | 1.7% |
| Standard Deviation (Sample) | 10.7% | 2.3% |
| Standard Deviation (Population) | 10.7% | 2.3% |
Similar Demographics by Disability Age 5 to 17
Demographics Similar to English by Disability Age 5 to 17
In terms of disability age 5 to 17, the demographic groups most similar to English are Subsaharan African (6.2%, a difference of 0.0%), Ugandan (6.2%, a difference of 0.030%), Colville (6.2%, a difference of 0.040%), German (6.1%, a difference of 0.19%), and Pima (6.2%, a difference of 0.23%).
| Demographics | Rating | Rank | Disability Age 5 to 17 |
| Immigrants | Liberia | 0.1 /100 | #278 | Tragic 6.1% |
| Immigrants | Jamaica | 0.1 /100 | #279 | Tragic 6.1% |
| Portuguese | 0.1 /100 | #280 | Tragic 6.1% |
| Scottish | 0.0 /100 | #281 | Tragic 6.1% |
| Germans | 0.0 /100 | #282 | Tragic 6.1% |
| Ugandans | 0.0 /100 | #283 | Tragic 6.2% |
| Sub-Saharan Africans | 0.0 /100 | #284 | Tragic 6.2% |
| English | 0.0 /100 | #285 | Tragic 6.2% |
| Colville | 0.0 /100 | #286 | Tragic 6.2% |
| Pima | 0.0 /100 | #287 | Tragic 6.2% |
| Jamaicans | 0.0 /100 | #288 | Tragic 6.2% |
| Yaqui | 0.0 /100 | #289 | Tragic 6.2% |
| Immigrants | Congo | 0.0 /100 | #290 | Tragic 6.2% |
| Whites/Caucasians | 0.0 /100 | #291 | Tragic 6.2% |
| Immigrants | Senegal | 0.0 /100 | #292 | Tragic 6.2% |
Demographics Similar to Immigrants from Nigeria by Disability Age 5 to 17
In terms of disability age 5 to 17, the demographic groups most similar to Immigrants from Nigeria are Croatian (5.7%, a difference of 0.010%), Inupiat (5.7%, a difference of 0.010%), Immigrants from North America (5.7%, a difference of 0.020%), Immigrants from Canada (5.7%, a difference of 0.17%), and Norwegian (5.7%, a difference of 0.18%).
| Demographics | Rating | Rank | Disability Age 5 to 17 |
| Marshallese | 28.1 /100 | #188 | Fair 5.7% |
| Pueblo | 27.5 /100 | #189 | Fair 5.7% |
| Immigrants | Eastern Africa | 27.3 /100 | #190 | Fair 5.7% |
| Danes | 26.5 /100 | #191 | Fair 5.7% |
| Immigrants | Bosnia and Herzegovina | 26.3 /100 | #192 | Fair 5.7% |
| Immigrants | Canada | 26.1 /100 | #193 | Fair 5.7% |
| Croatians | 23.6 /100 | #194 | Fair 5.7% |
| Immigrants | Nigeria | 23.4 /100 | #195 | Fair 5.7% |
| Inupiat | 23.3 /100 | #196 | Fair 5.7% |
| Immigrants | North America | 23.1 /100 | #197 | Fair 5.7% |
| Norwegians | 20.9 /100 | #198 | Fair 5.7% |
| Northern Europeans | 15.2 /100 | #199 | Poor 5.7% |
| Icelanders | 14.6 /100 | #200 | Poor 5.7% |
| Basques | 13.7 /100 | #201 | Poor 5.7% |
| Austrians | 13.2 /100 | #202 | Poor 5.7% |