Hawaiian vs New Zealander Disability
COMPARE
Hawaiian
New Zealander
Disability
Disability Comparison
Hawaiians
New Zealanders
12.5%
DISABILITY
0.2/ 100
METRIC RATING
263rd/ 347
METRIC RANK
11.5%
DISABILITY
87.0/ 100
METRIC RATING
138th/ 347
METRIC RANK
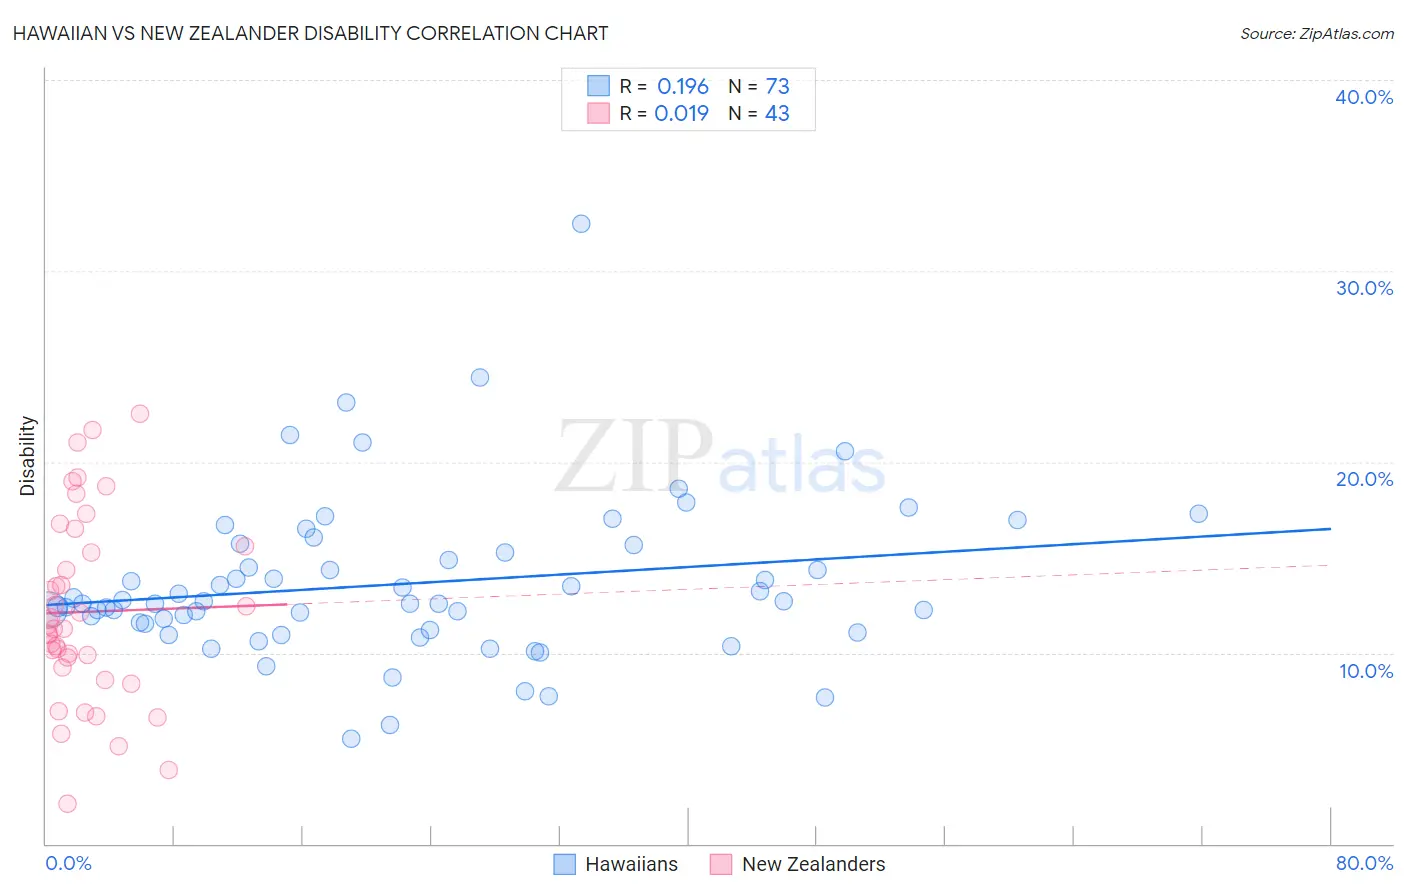
Hawaiian vs New Zealander Disability Correlation Chart
The statistical analysis conducted on geographies consisting of 327,510,091 people shows a poor positive correlation between the proportion of Hawaiians and percentage of population with a disability in the United States with a correlation coefficient (R) of 0.196 and weighted average of 12.5%. Similarly, the statistical analysis conducted on geographies consisting of 106,922,705 people shows no correlation between the proportion of New Zealanders and percentage of population with a disability in the United States with a correlation coefficient (R) of 0.019 and weighted average of 11.5%, a difference of 8.9%.
Disability Correlation Summary
| Measurement | Hawaiian | New Zealander |
| Minimum | 5.5% | 2.1% |
| Maximum | 32.5% | 22.5% |
| Range | 27.0% | 20.4% |
| Mean | 13.6% | 12.1% |
| Median | 12.6% | 11.3% |
| Interquartile 25% (IQ1) | 11.4% | 9.2% |
| Interquartile 75% (IQ3) | 15.5% | 15.6% |
| Interquartile Range (IQR) | 4.1% | 6.4% |
| Standard Deviation (Sample) | 4.2% | 4.9% |
| Standard Deviation (Population) | 4.2% | 4.8% |
Similar Demographics by Disability
Demographics Similar to Hawaiians by Disability
In terms of disability, the demographic groups most similar to Hawaiians are Immigrants from Germany (12.5%, a difference of 0.11%), U.S. Virgin Islander (12.5%, a difference of 0.13%), Native Hawaiian (12.5%, a difference of 0.20%), Czechoslovakian (12.5%, a difference of 0.29%), and Spaniard (12.5%, a difference of 0.37%).
| Demographics | Rating | Rank | Disability |
| Immigrants | Dominica | 0.6 /100 | #256 | Tragic 12.4% |
| Immigrants | Laos | 0.5 /100 | #257 | Tragic 12.4% |
| Slavs | 0.5 /100 | #258 | Tragic 12.4% |
| Canadians | 0.4 /100 | #259 | Tragic 12.4% |
| Immigrants | Liberia | 0.4 /100 | #260 | Tragic 12.4% |
| Scandinavians | 0.4 /100 | #261 | Tragic 12.4% |
| Native Hawaiians | 0.3 /100 | #262 | Tragic 12.5% |
| Hawaiians | 0.2 /100 | #263 | Tragic 12.5% |
| Immigrants | Germany | 0.2 /100 | #264 | Tragic 12.5% |
| U.S. Virgin Islanders | 0.2 /100 | #265 | Tragic 12.5% |
| Czechoslovakians | 0.2 /100 | #266 | Tragic 12.5% |
| Spaniards | 0.2 /100 | #267 | Tragic 12.5% |
| Bangladeshis | 0.1 /100 | #268 | Tragic 12.6% |
| Immigrants | Dominican Republic | 0.1 /100 | #269 | Tragic 12.6% |
| Portuguese | 0.1 /100 | #270 | Tragic 12.6% |
Demographics Similar to New Zealanders by Disability
In terms of disability, the demographic groups most similar to New Zealanders are Ghanaian (11.5%, a difference of 0.0%), Kenyan (11.5%, a difference of 0.010%), Russian (11.5%, a difference of 0.020%), Immigrants from St. Vincent and the Grenadines (11.4%, a difference of 0.080%), and Ugandan (11.4%, a difference of 0.090%).
| Demographics | Rating | Rank | Disability |
| Immigrants | Croatia | 89.8 /100 | #131 | Excellent 11.4% |
| Immigrants | Africa | 89.3 /100 | #132 | Excellent 11.4% |
| Arabs | 89.1 /100 | #133 | Excellent 11.4% |
| Immigrants | Guyana | 88.3 /100 | #134 | Excellent 11.4% |
| Ugandans | 87.9 /100 | #135 | Excellent 11.4% |
| Immigrants | St. Vincent and the Grenadines | 87.8 /100 | #136 | Excellent 11.4% |
| Kenyans | 87.1 /100 | #137 | Excellent 11.5% |
| New Zealanders | 87.0 /100 | #138 | Excellent 11.5% |
| Ghanaians | 87.0 /100 | #139 | Excellent 11.5% |
| Russians | 86.8 /100 | #140 | Excellent 11.5% |
| Immigrants | Grenada | 86.1 /100 | #141 | Excellent 11.5% |
| Immigrants | Sudan | 85.3 /100 | #142 | Excellent 11.5% |
| Moroccans | 83.3 /100 | #143 | Excellent 11.5% |
| Australians | 82.5 /100 | #144 | Excellent 11.5% |
| Nigerians | 81.3 /100 | #145 | Excellent 11.5% |