Hawaiian vs Immigrants from Haiti Disability
COMPARE
Hawaiian
Immigrants from Haiti
Disability
Disability Comparison
Hawaiians
Immigrants from Haiti
12.5%
DISABILITY
0.2/ 100
METRIC RATING
263rd/ 347
METRIC RANK
11.7%
DISABILITY
59.2/ 100
METRIC RATING
162nd/ 347
METRIC RANK
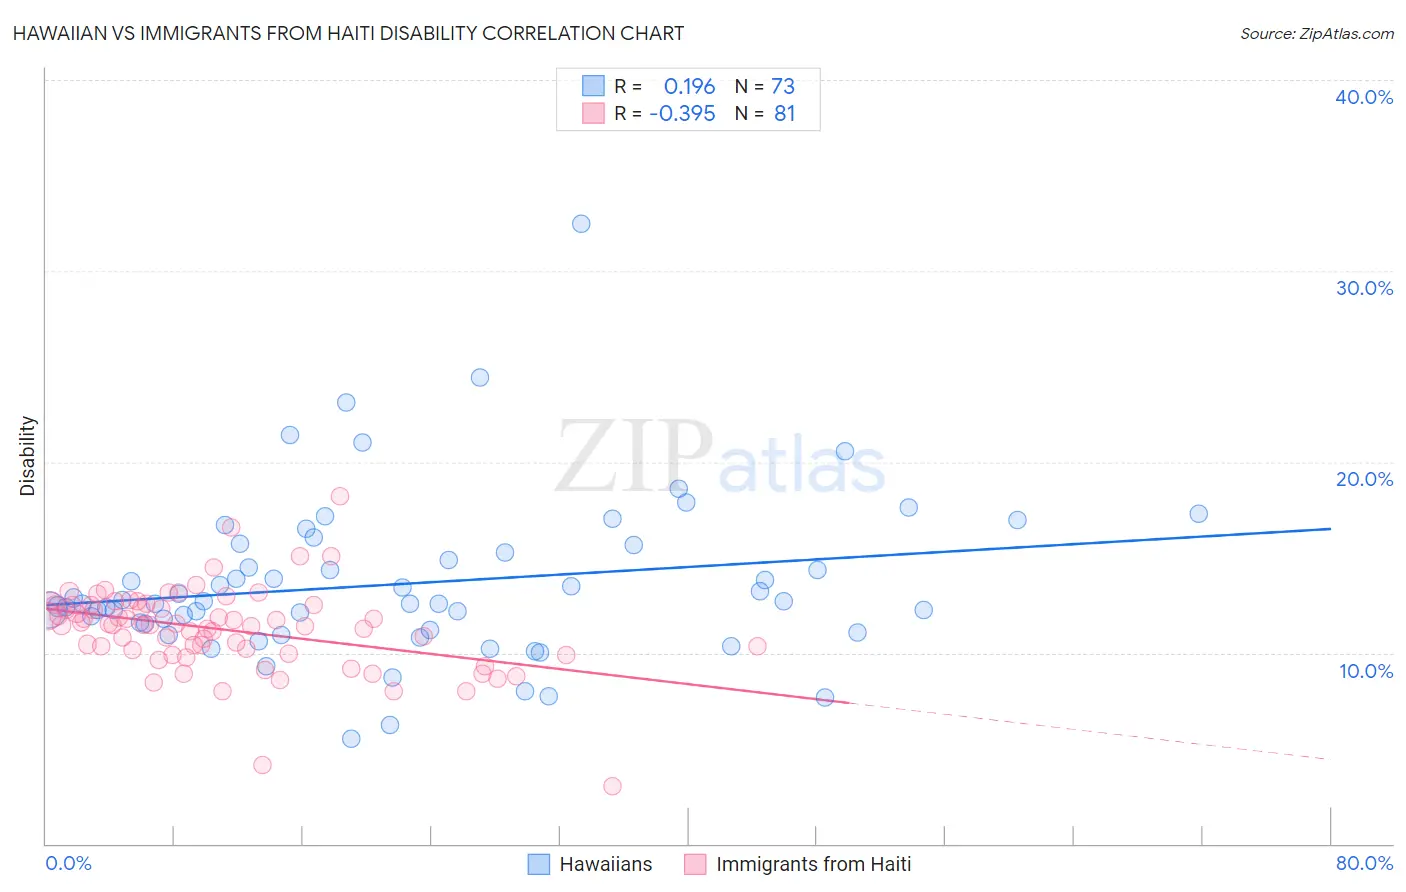
Hawaiian vs Immigrants from Haiti Disability Correlation Chart
The statistical analysis conducted on geographies consisting of 327,510,091 people shows a poor positive correlation between the proportion of Hawaiians and percentage of population with a disability in the United States with a correlation coefficient (R) of 0.196 and weighted average of 12.5%. Similarly, the statistical analysis conducted on geographies consisting of 225,241,384 people shows a mild negative correlation between the proportion of Immigrants from Haiti and percentage of population with a disability in the United States with a correlation coefficient (R) of -0.395 and weighted average of 11.7%, a difference of 7.1%.
Disability Correlation Summary
| Measurement | Hawaiian | Immigrants from Haiti |
| Minimum | 5.5% | 3.0% |
| Maximum | 32.5% | 18.2% |
| Range | 27.0% | 15.2% |
| Mean | 13.6% | 11.2% |
| Median | 12.6% | 11.5% |
| Interquartile 25% (IQ1) | 11.4% | 10.1% |
| Interquartile 75% (IQ3) | 15.5% | 12.5% |
| Interquartile Range (IQR) | 4.1% | 2.4% |
| Standard Deviation (Sample) | 4.2% | 2.2% |
| Standard Deviation (Population) | 4.2% | 2.2% |
Similar Demographics by Disability
Demographics Similar to Hawaiians by Disability
In terms of disability, the demographic groups most similar to Hawaiians are Immigrants from Germany (12.5%, a difference of 0.11%), U.S. Virgin Islander (12.5%, a difference of 0.13%), Native Hawaiian (12.5%, a difference of 0.20%), Czechoslovakian (12.5%, a difference of 0.29%), and Spaniard (12.5%, a difference of 0.37%).
| Demographics | Rating | Rank | Disability |
| Immigrants | Dominica | 0.6 /100 | #256 | Tragic 12.4% |
| Immigrants | Laos | 0.5 /100 | #257 | Tragic 12.4% |
| Slavs | 0.5 /100 | #258 | Tragic 12.4% |
| Canadians | 0.4 /100 | #259 | Tragic 12.4% |
| Immigrants | Liberia | 0.4 /100 | #260 | Tragic 12.4% |
| Scandinavians | 0.4 /100 | #261 | Tragic 12.4% |
| Native Hawaiians | 0.3 /100 | #262 | Tragic 12.5% |
| Hawaiians | 0.2 /100 | #263 | Tragic 12.5% |
| Immigrants | Germany | 0.2 /100 | #264 | Tragic 12.5% |
| U.S. Virgin Islanders | 0.2 /100 | #265 | Tragic 12.5% |
| Czechoslovakians | 0.2 /100 | #266 | Tragic 12.5% |
| Spaniards | 0.2 /100 | #267 | Tragic 12.5% |
| Bangladeshis | 0.1 /100 | #268 | Tragic 12.6% |
| Immigrants | Dominican Republic | 0.1 /100 | #269 | Tragic 12.6% |
| Portuguese | 0.1 /100 | #270 | Tragic 12.6% |
Demographics Similar to Immigrants from Haiti by Disability
In terms of disability, the demographic groups most similar to Immigrants from Haiti are Immigrants from Trinidad and Tobago (11.7%, a difference of 0.020%), Syrian (11.7%, a difference of 0.030%), Cuban (11.7%, a difference of 0.12%), Immigrants from Cuba (11.6%, a difference of 0.17%), and Pakistani (11.7%, a difference of 0.21%).
| Demographics | Rating | Rank | Disability |
| Immigrants | Netherlands | 69.8 /100 | #155 | Good 11.6% |
| Immigrants | Fiji | 69.5 /100 | #156 | Good 11.6% |
| Immigrants | Middle Africa | 69.5 /100 | #157 | Good 11.6% |
| Armenians | 65.9 /100 | #158 | Good 11.6% |
| Guatemalans | 65.1 /100 | #159 | Good 11.6% |
| Immigrants | Barbados | 64.2 /100 | #160 | Good 11.6% |
| Immigrants | Cuba | 62.8 /100 | #161 | Good 11.6% |
| Immigrants | Haiti | 59.2 /100 | #162 | Average 11.7% |
| Immigrants | Trinidad and Tobago | 58.9 /100 | #163 | Average 11.7% |
| Syrians | 58.5 /100 | #164 | Average 11.7% |
| Cubans | 56.7 /100 | #165 | Average 11.7% |
| Pakistanis | 54.7 /100 | #166 | Average 11.7% |
| Estonians | 54.4 /100 | #167 | Average 11.7% |
| Immigrants | Latin America | 54.1 /100 | #168 | Average 11.7% |
| Immigrants | Austria | 53.4 /100 | #169 | Average 11.7% |