Hawaiian vs Immigrants from Italy Disability
COMPARE
Hawaiian
Immigrants from Italy
Disability
Disability Comparison
Hawaiians
Immigrants from Italy
12.5%
DISABILITY
0.2/ 100
METRIC RATING
263rd/ 347
METRIC RANK
11.4%
DISABILITY
90.4/ 100
METRIC RATING
127th/ 347
METRIC RANK
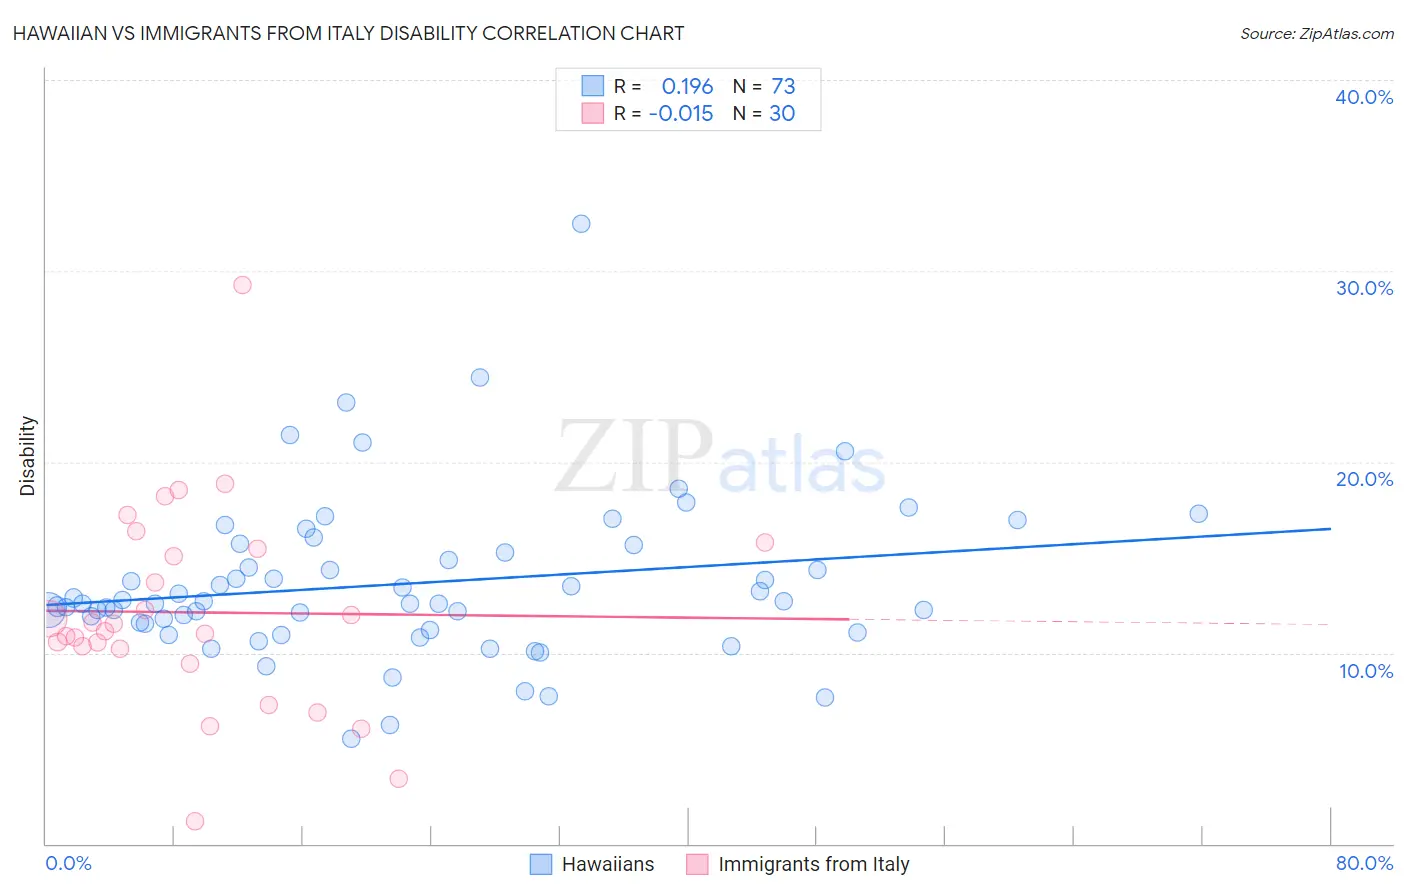
Hawaiian vs Immigrants from Italy Disability Correlation Chart
The statistical analysis conducted on geographies consisting of 327,510,091 people shows a poor positive correlation between the proportion of Hawaiians and percentage of population with a disability in the United States with a correlation coefficient (R) of 0.196 and weighted average of 12.5%. Similarly, the statistical analysis conducted on geographies consisting of 324,217,000 people shows no correlation between the proportion of Immigrants from Italy and percentage of population with a disability in the United States with a correlation coefficient (R) of -0.015 and weighted average of 11.4%, a difference of 9.3%.
Disability Correlation Summary
| Measurement | Hawaiian | Immigrants from Italy |
| Minimum | 5.5% | 1.2% |
| Maximum | 32.5% | 29.3% |
| Range | 27.0% | 28.1% |
| Mean | 13.6% | 12.1% |
| Median | 12.6% | 11.3% |
| Interquartile 25% (IQ1) | 11.4% | 10.2% |
| Interquartile 75% (IQ3) | 15.5% | 15.4% |
| Interquartile Range (IQR) | 4.1% | 5.2% |
| Standard Deviation (Sample) | 4.2% | 5.4% |
| Standard Deviation (Population) | 4.2% | 5.3% |
Similar Demographics by Disability
Demographics Similar to Hawaiians by Disability
In terms of disability, the demographic groups most similar to Hawaiians are Immigrants from Germany (12.5%, a difference of 0.11%), U.S. Virgin Islander (12.5%, a difference of 0.13%), Native Hawaiian (12.5%, a difference of 0.20%), Czechoslovakian (12.5%, a difference of 0.29%), and Spaniard (12.5%, a difference of 0.37%).
| Demographics | Rating | Rank | Disability |
| Immigrants | Dominica | 0.6 /100 | #256 | Tragic 12.4% |
| Immigrants | Laos | 0.5 /100 | #257 | Tragic 12.4% |
| Slavs | 0.5 /100 | #258 | Tragic 12.4% |
| Canadians | 0.4 /100 | #259 | Tragic 12.4% |
| Immigrants | Liberia | 0.4 /100 | #260 | Tragic 12.4% |
| Scandinavians | 0.4 /100 | #261 | Tragic 12.4% |
| Native Hawaiians | 0.3 /100 | #262 | Tragic 12.5% |
| Hawaiians | 0.2 /100 | #263 | Tragic 12.5% |
| Immigrants | Germany | 0.2 /100 | #264 | Tragic 12.5% |
| U.S. Virgin Islanders | 0.2 /100 | #265 | Tragic 12.5% |
| Czechoslovakians | 0.2 /100 | #266 | Tragic 12.5% |
| Spaniards | 0.2 /100 | #267 | Tragic 12.5% |
| Bangladeshis | 0.1 /100 | #268 | Tragic 12.6% |
| Immigrants | Dominican Republic | 0.1 /100 | #269 | Tragic 12.6% |
| Portuguese | 0.1 /100 | #270 | Tragic 12.6% |
Demographics Similar to Immigrants from Italy by Disability
In terms of disability, the demographic groups most similar to Immigrants from Italy are Immigrants from Europe (11.4%, a difference of 0.0%), Macedonian (11.4%, a difference of 0.020%), Immigrants from Latvia (11.4%, a difference of 0.070%), Latvian (11.4%, a difference of 0.070%), and Immigrants from Croatia (11.4%, a difference of 0.080%).
| Demographics | Rating | Rank | Disability |
| Immigrants | North Macedonia | 93.5 /100 | #120 | Exceptional 11.4% |
| Immigrants | Costa Rica | 93.4 /100 | #121 | Exceptional 11.4% |
| Brazilians | 93.3 /100 | #122 | Exceptional 11.4% |
| South Africans | 92.3 /100 | #123 | Exceptional 11.4% |
| South American Indians | 92.2 /100 | #124 | Exceptional 11.4% |
| Costa Ricans | 91.9 /100 | #125 | Exceptional 11.4% |
| Immigrants | Latvia | 90.9 /100 | #126 | Exceptional 11.4% |
| Immigrants | Italy | 90.4 /100 | #127 | Exceptional 11.4% |
| Immigrants | Europe | 90.4 /100 | #128 | Exceptional 11.4% |
| Macedonians | 90.3 /100 | #129 | Exceptional 11.4% |
| Latvians | 89.8 /100 | #130 | Excellent 11.4% |
| Immigrants | Croatia | 89.8 /100 | #131 | Excellent 11.4% |
| Immigrants | Africa | 89.3 /100 | #132 | Excellent 11.4% |
| Arabs | 89.1 /100 | #133 | Excellent 11.4% |
| Immigrants | Guyana | 88.3 /100 | #134 | Excellent 11.4% |