Hawaiian vs Shoshone Unemployment Among Ages 25 to 29 years
COMPARE
Hawaiian
Shoshone
Unemployment Among Ages 25 to 29 years
Unemployment Among Ages 25 to 29 years Comparison
Hawaiians
Shoshone
6.8%
UNEMPLOYMENT AMONG AGES 25 TO 29 YEARS
17.1/ 100
METRIC RATING
209th/ 347
METRIC RANK
9.2%
UNEMPLOYMENT AMONG AGES 25 TO 29 YEARS
0.0/ 100
METRIC RATING
326th/ 347
METRIC RANK
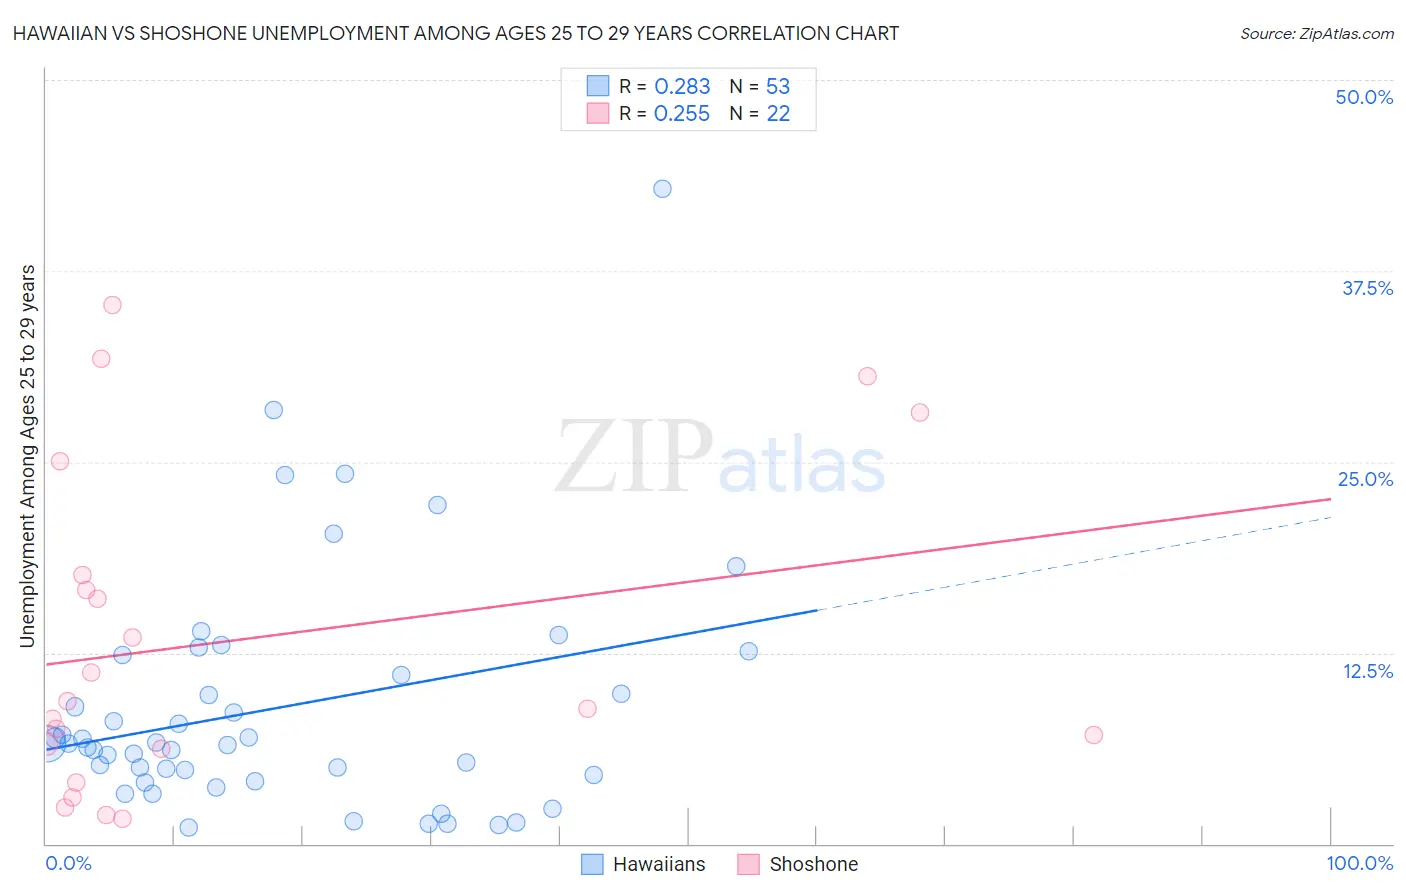
Hawaiian vs Shoshone Unemployment Among Ages 25 to 29 years Correlation Chart
The statistical analysis conducted on geographies consisting of 314,743,173 people shows a weak positive correlation between the proportion of Hawaiians and unemployment rate among population between the ages 25 and 29 in the United States with a correlation coefficient (R) of 0.283 and weighted average of 6.8%. Similarly, the statistical analysis conducted on geographies consisting of 65,507,418 people shows a weak positive correlation between the proportion of Shoshone and unemployment rate among population between the ages 25 and 29 in the United States with a correlation coefficient (R) of 0.255 and weighted average of 9.2%, a difference of 35.5%.
Unemployment Among Ages 25 to 29 years Correlation Summary
| Measurement | Hawaiian | Shoshone |
| Minimum | 1.1% | 1.6% |
| Maximum | 42.9% | 35.2% |
| Range | 41.8% | 33.6% |
| Mean | 8.9% | 13.3% |
| Median | 6.5% | 9.1% |
| Interquartile 25% (IQ1) | 4.3% | 6.2% |
| Interquartile 75% (IQ3) | 11.7% | 17.6% |
| Interquartile Range (IQR) | 7.4% | 11.4% |
| Standard Deviation (Sample) | 7.9% | 10.5% |
| Standard Deviation (Population) | 7.9% | 10.3% |
Similar Demographics by Unemployment Among Ages 25 to 29 years
Demographics Similar to Hawaiians by Unemployment Among Ages 25 to 29 years
In terms of unemployment among ages 25 to 29 years, the demographic groups most similar to Hawaiians are Canadian (6.8%, a difference of 0.020%), Immigrants from Philippines (6.8%, a difference of 0.050%), Immigrants from Cabo Verde (6.8%, a difference of 0.10%), Immigrants from Germany (6.8%, a difference of 0.18%), and Immigrants from Denmark (6.8%, a difference of 0.20%).
| Demographics | Rating | Rank | Unemployment Among Ages 25 to 29 years |
| Immigrants | Argentina | 21.6 /100 | #202 | Fair 6.8% |
| Immigrants | Norway | 21.2 /100 | #203 | Fair 6.8% |
| Scotch-Irish | 20.0 /100 | #204 | Poor 6.8% |
| Immigrants | England | 19.8 /100 | #205 | Poor 6.8% |
| Ugandans | 19.8 /100 | #206 | Poor 6.8% |
| Immigrants | Denmark | 19.0 /100 | #207 | Poor 6.8% |
| Immigrants | Germany | 18.8 /100 | #208 | Poor 6.8% |
| Hawaiians | 17.1 /100 | #209 | Poor 6.8% |
| Canadians | 16.9 /100 | #210 | Poor 6.8% |
| Immigrants | Philippines | 16.7 /100 | #211 | Poor 6.8% |
| Immigrants | Cabo Verde | 16.2 /100 | #212 | Poor 6.8% |
| Immigrants | Syria | 15.1 /100 | #213 | Poor 6.8% |
| Liberians | 14.7 /100 | #214 | Poor 6.8% |
| Spanish | 14.4 /100 | #215 | Poor 6.8% |
| Slovaks | 14.3 /100 | #216 | Poor 6.8% |
Demographics Similar to Shoshone by Unemployment Among Ages 25 to 29 years
In terms of unemployment among ages 25 to 29 years, the demographic groups most similar to Shoshone are Colville (9.2%, a difference of 0.16%), Apache (9.5%, a difference of 2.8%), Aleut (9.7%, a difference of 5.0%), Yakama (8.8%, a difference of 5.3%), and Houma (8.7%, a difference of 5.8%).
| Demographics | Rating | Rank | Unemployment Among Ages 25 to 29 years |
| Immigrants | Armenia | 0.0 /100 | #319 | Tragic 8.5% |
| Blacks/African Americans | 0.0 /100 | #320 | Tragic 8.6% |
| Immigrants | Dominican Republic | 0.0 /100 | #321 | Tragic 8.6% |
| Tlingit-Haida | 0.0 /100 | #322 | Tragic 8.7% |
| Dominicans | 0.0 /100 | #323 | Tragic 8.7% |
| Houma | 0.0 /100 | #324 | Tragic 8.7% |
| Yakama | 0.0 /100 | #325 | Tragic 8.8% |
| Shoshone | 0.0 /100 | #326 | Tragic 9.2% |
| Colville | 0.0 /100 | #327 | Tragic 9.2% |
| Apache | 0.0 /100 | #328 | Tragic 9.5% |
| Aleuts | 0.0 /100 | #329 | Tragic 9.7% |
| Natives/Alaskans | 0.0 /100 | #330 | Tragic 9.8% |
| Alaska Natives | 0.0 /100 | #331 | Tragic 10.2% |
| Pueblo | 0.0 /100 | #332 | Tragic 10.4% |
| Alaskan Athabascans | 0.0 /100 | #333 | Tragic 10.8% |