Hawaiian vs Czechoslovakian Self-Care Disability
COMPARE
Hawaiian
Czechoslovakian
Self-Care Disability
Self-Care Disability Comparison
Hawaiians
Czechoslovakians
2.6%
SELF-CARE DISABILITY
0.8/ 100
METRIC RATING
243rd/ 347
METRIC RANK
2.5%
SELF-CARE DISABILITY
53.5/ 100
METRIC RATING
172nd/ 347
METRIC RANK
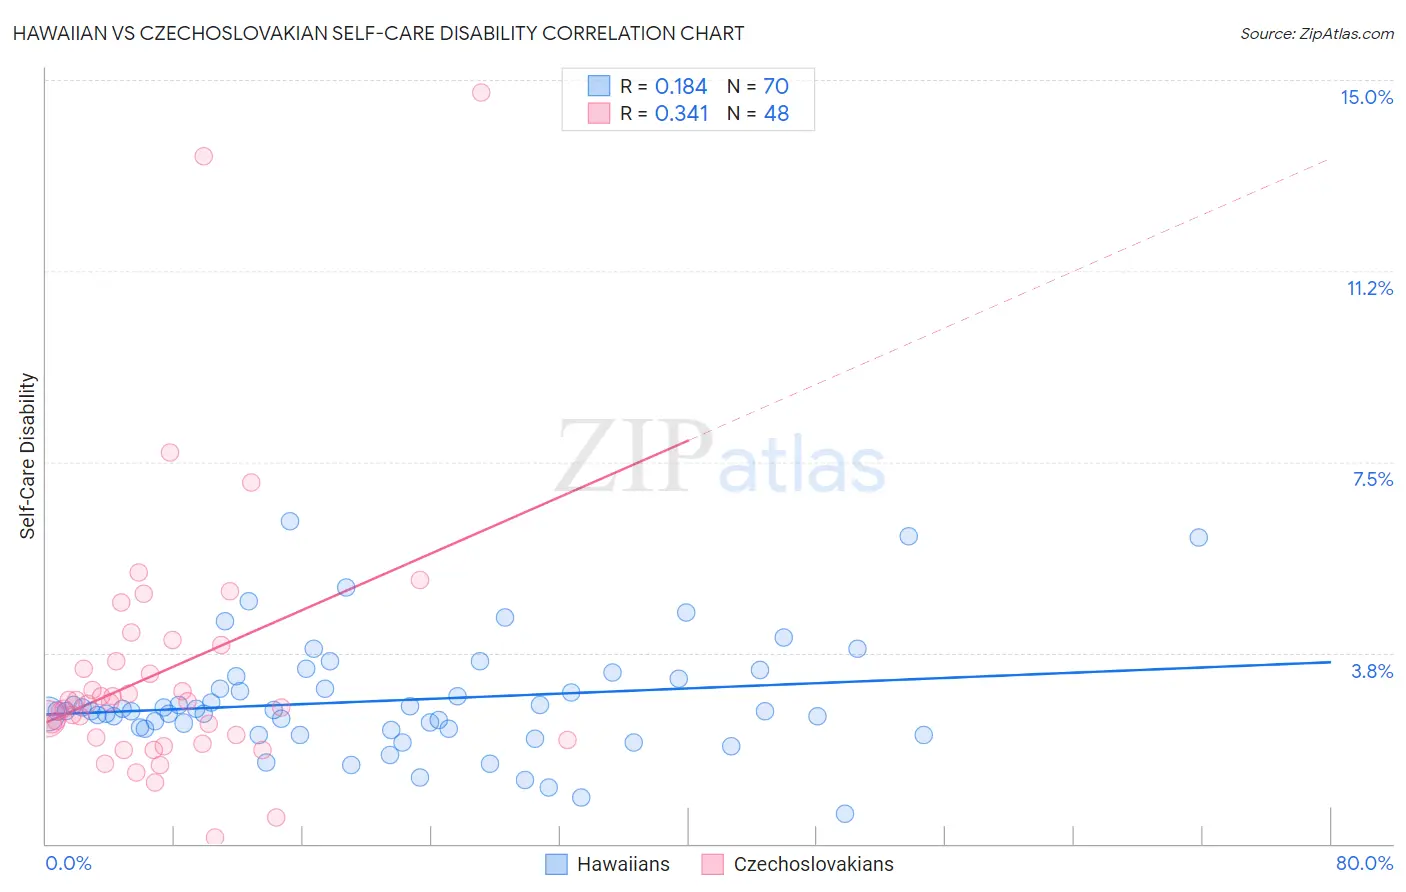
Hawaiian vs Czechoslovakian Self-Care Disability Correlation Chart
The statistical analysis conducted on geographies consisting of 327,105,730 people shows a poor positive correlation between the proportion of Hawaiians and percentage of population with self-care disability in the United States with a correlation coefficient (R) of 0.184 and weighted average of 2.6%. Similarly, the statistical analysis conducted on geographies consisting of 368,314,716 people shows a mild positive correlation between the proportion of Czechoslovakians and percentage of population with self-care disability in the United States with a correlation coefficient (R) of 0.341 and weighted average of 2.5%, a difference of 5.9%.
Self-Care Disability Correlation Summary
| Measurement | Hawaiian | Czechoslovakian |
| Minimum | 0.59% | 0.12% |
| Maximum | 6.3% | 14.8% |
| Range | 5.8% | 14.6% |
| Mean | 2.8% | 3.4% |
| Median | 2.6% | 2.8% |
| Interquartile 25% (IQ1) | 2.3% | 2.1% |
| Interquartile 75% (IQ3) | 3.2% | 3.7% |
| Interquartile Range (IQR) | 0.97% | 1.7% |
| Standard Deviation (Sample) | 1.1% | 2.7% |
| Standard Deviation (Population) | 1.1% | 2.7% |
Similar Demographics by Self-Care Disability
Demographics Similar to Hawaiians by Self-Care Disability
In terms of self-care disability, the demographic groups most similar to Hawaiians are Yuman (2.6%, a difference of 0.040%), Spanish (2.6%, a difference of 0.070%), Immigrants from Western Asia (2.6%, a difference of 0.23%), Cheyenne (2.6%, a difference of 0.25%), and Immigrants from Syria (2.6%, a difference of 0.31%).
| Demographics | Rating | Rank | Self-Care Disability |
| Bermudans | 1.9 /100 | #236 | Tragic 2.6% |
| Immigrants | Senegal | 1.6 /100 | #237 | Tragic 2.6% |
| Senegalese | 1.3 /100 | #238 | Tragic 2.6% |
| Immigrants | Panama | 1.2 /100 | #239 | Tragic 2.6% |
| Marshallese | 1.2 /100 | #240 | Tragic 2.6% |
| Immigrants | Syria | 1.0 /100 | #241 | Tragic 2.6% |
| Spanish | 0.8 /100 | #242 | Tragic 2.6% |
| Hawaiians | 0.8 /100 | #243 | Tragic 2.6% |
| Yuman | 0.8 /100 | #244 | Tragic 2.6% |
| Immigrants | Western Asia | 0.6 /100 | #245 | Tragic 2.6% |
| Cheyenne | 0.6 /100 | #246 | Tragic 2.6% |
| Immigrants | Albania | 0.6 /100 | #247 | Tragic 2.6% |
| Nicaraguans | 0.6 /100 | #248 | Tragic 2.6% |
| Mexican American Indians | 0.5 /100 | #249 | Tragic 2.6% |
| Portuguese | 0.4 /100 | #250 | Tragic 2.6% |
Demographics Similar to Czechoslovakians by Self-Care Disability
In terms of self-care disability, the demographic groups most similar to Czechoslovakians are Pennsylvania German (2.5%, a difference of 0.0%), Immigrants from Burma/Myanmar (2.5%, a difference of 0.030%), Scottish (2.5%, a difference of 0.040%), Immigrants from Somalia (2.5%, a difference of 0.12%), and Welsh (2.5%, a difference of 0.17%).
| Demographics | Rating | Rank | Self-Care Disability |
| Syrians | 59.0 /100 | #165 | Average 2.5% |
| Canadians | 58.8 /100 | #166 | Average 2.5% |
| Immigrants | Greece | 57.3 /100 | #167 | Average 2.5% |
| Ute | 57.1 /100 | #168 | Average 2.5% |
| Immigrants | Somalia | 55.9 /100 | #169 | Average 2.5% |
| Scottish | 54.3 /100 | #170 | Average 2.5% |
| Pennsylvania Germans | 53.5 /100 | #171 | Average 2.5% |
| Czechoslovakians | 53.5 /100 | #172 | Average 2.5% |
| Immigrants | Burma/Myanmar | 52.8 /100 | #173 | Average 2.5% |
| Welsh | 50.0 /100 | #174 | Average 2.5% |
| Immigrants | Bosnia and Herzegovina | 49.6 /100 | #175 | Average 2.5% |
| Immigrants | Afghanistan | 47.6 /100 | #176 | Average 2.5% |
| Immigrants | Kazakhstan | 46.7 /100 | #177 | Average 2.5% |
| English | 46.2 /100 | #178 | Average 2.5% |
| Hungarians | 45.5 /100 | #179 | Average 2.5% |