Hawaiian vs Immigrants from Uruguay Married-couple Households
COMPARE
Hawaiian
Immigrants from Uruguay
Married-couple Households
Married-couple Households Comparison
Hawaiians
Immigrants from Uruguay
47.8%
MARRIED-COUPLE HOUSEHOLDS
96.0/ 100
METRIC RATING
103rd/ 347
METRIC RANK
44.5%
MARRIED-COUPLE HOUSEHOLDS
1.1/ 100
METRIC RATING
238th/ 347
METRIC RANK
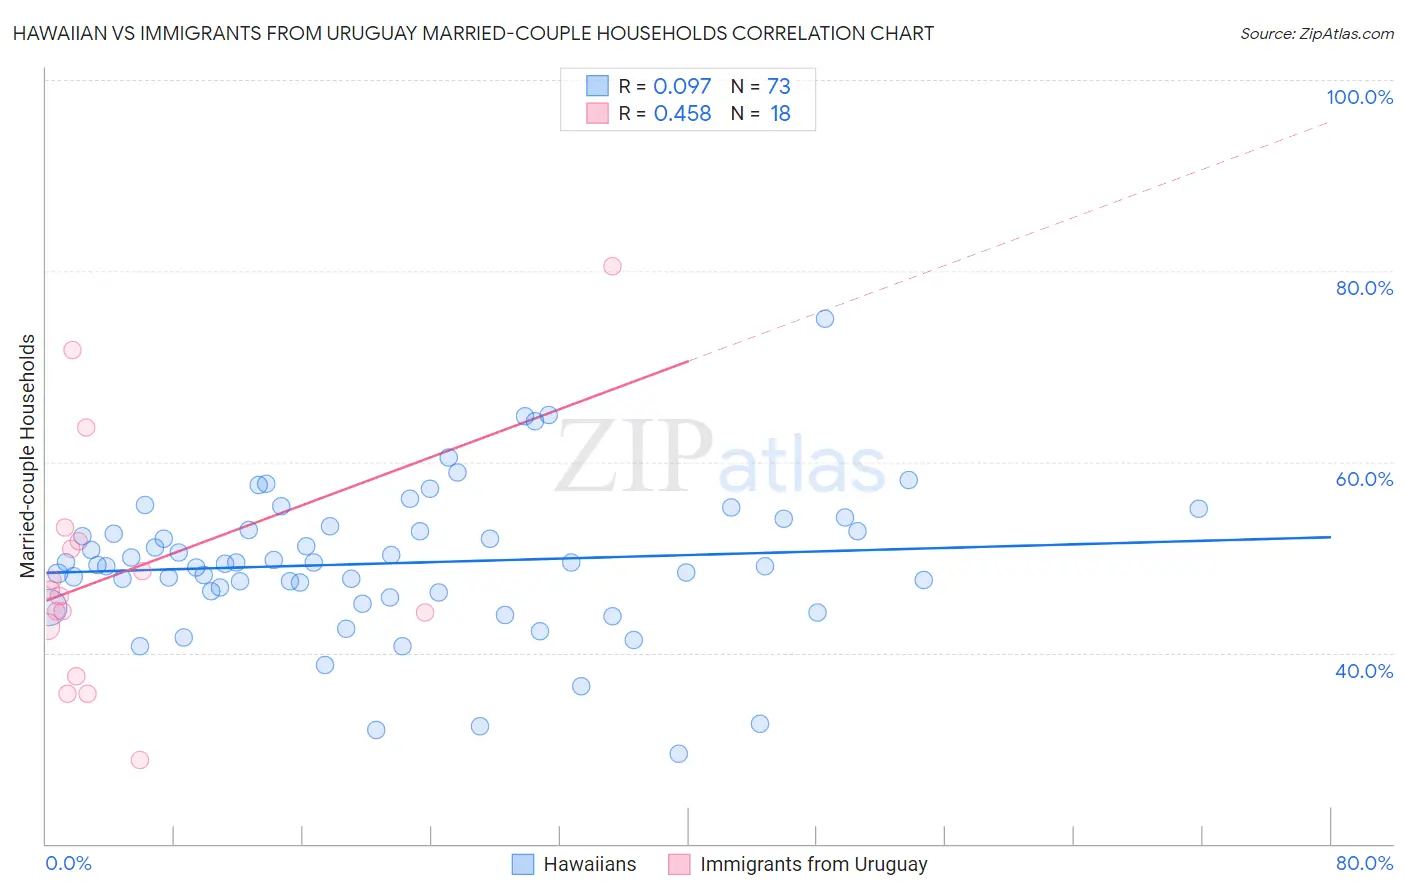
Hawaiian vs Immigrants from Uruguay Married-couple Households Correlation Chart
The statistical analysis conducted on geographies consisting of 327,384,536 people shows a slight positive correlation between the proportion of Hawaiians and percentage of married-couple family households in the United States with a correlation coefficient (R) of 0.097 and weighted average of 47.8%. Similarly, the statistical analysis conducted on geographies consisting of 133,245,142 people shows a moderate positive correlation between the proportion of Immigrants from Uruguay and percentage of married-couple family households in the United States with a correlation coefficient (R) of 0.458 and weighted average of 44.5%, a difference of 7.5%.
Married-couple Households Correlation Summary
| Measurement | Hawaiian | Immigrants from Uruguay |
| Minimum | 29.5% | 28.8% |
| Maximum | 75.0% | 80.5% |
| Range | 45.5% | 51.7% |
| Mean | 49.4% | 48.5% |
| Median | 49.3% | 46.2% |
| Interquartile 25% (IQ1) | 46.0% | 42.8% |
| Interquartile 75% (IQ3) | 53.0% | 51.7% |
| Interquartile Range (IQR) | 7.0% | 8.9% |
| Standard Deviation (Sample) | 7.7% | 12.7% |
| Standard Deviation (Population) | 7.7% | 12.4% |
Similar Demographics by Married-couple Households
Demographics Similar to Hawaiians by Married-couple Households
In terms of married-couple households, the demographic groups most similar to Hawaiians are Slavic (47.8%, a difference of 0.0%), Immigrants from South Africa (47.8%, a difference of 0.010%), Turkish (47.8%, a difference of 0.020%), Immigrants from Italy (47.9%, a difference of 0.080%), and Immigrants from Austria (47.9%, a difference of 0.090%).
| Demographics | Rating | Rank | Married-couple Households |
| Immigrants | Egypt | 96.6 /100 | #96 | Exceptional 47.9% |
| Latvians | 96.5 /100 | #97 | Exceptional 47.9% |
| Immigrants | North Macedonia | 96.4 /100 | #98 | Exceptional 47.9% |
| Immigrants | Austria | 96.4 /100 | #99 | Exceptional 47.9% |
| Immigrants | Italy | 96.3 /100 | #100 | Exceptional 47.9% |
| Turks | 96.1 /100 | #101 | Exceptional 47.8% |
| Slavs | 96.0 /100 | #102 | Exceptional 47.8% |
| Hawaiians | 96.0 /100 | #103 | Exceptional 47.8% |
| Immigrants | South Africa | 96.0 /100 | #104 | Exceptional 47.8% |
| Immigrants | Czechoslovakia | 95.5 /100 | #105 | Exceptional 47.8% |
| Portuguese | 95.5 /100 | #106 | Exceptional 47.8% |
| Estonians | 94.7 /100 | #107 | Exceptional 47.7% |
| Immigrants | Japan | 94.4 /100 | #108 | Exceptional 47.7% |
| Immigrants | Jordan | 94.1 /100 | #109 | Exceptional 47.7% |
| Macedonians | 93.9 /100 | #110 | Exceptional 47.6% |
Demographics Similar to Immigrants from Uruguay by Married-couple Households
In terms of married-couple households, the demographic groups most similar to Immigrants from Uruguay are Spanish American (44.5%, a difference of 0.020%), Comanche (44.5%, a difference of 0.050%), Yaqui (44.5%, a difference of 0.080%), Immigrants from Nicaragua (44.5%, a difference of 0.090%), and Ute (44.4%, a difference of 0.10%).
| Demographics | Rating | Rank | Married-couple Households |
| Houma | 1.5 /100 | #231 | Tragic 44.6% |
| Marshallese | 1.5 /100 | #232 | Tragic 44.6% |
| Immigrants | Uganda | 1.5 /100 | #233 | Tragic 44.6% |
| Immigrants | Panama | 1.3 /100 | #234 | Tragic 44.6% |
| Immigrants | Nicaragua | 1.2 /100 | #235 | Tragic 44.5% |
| Yaqui | 1.2 /100 | #236 | Tragic 44.5% |
| Comanche | 1.2 /100 | #237 | Tragic 44.5% |
| Immigrants | Uruguay | 1.1 /100 | #238 | Tragic 44.5% |
| Spanish Americans | 1.1 /100 | #239 | Tragic 44.5% |
| Ute | 1.0 /100 | #240 | Tragic 44.4% |
| Immigrants | Bosnia and Herzegovina | 1.0 /100 | #241 | Tragic 44.4% |
| Immigrants | Albania | 1.0 /100 | #242 | Tragic 44.4% |
| Immigrants | Saudi Arabia | 0.9 /100 | #243 | Tragic 44.4% |
| Immigrants | Armenia | 0.7 /100 | #244 | Tragic 44.3% |
| Immigrants | El Salvador | 0.7 /100 | #245 | Tragic 44.3% |