Guyanese vs Kenyan Unemployment Among Ages 55 to 59 years
COMPARE
Guyanese
Kenyan
Unemployment Among Ages 55 to 59 years
Unemployment Among Ages 55 to 59 years Comparison
Guyanese
Kenyans
5.7%
UNEMPLOYMENT AMONG AGES 55 TO 59 YEARS
0.0/ 100
METRIC RATING
315th/ 347
METRIC RANK
4.4%
UNEMPLOYMENT AMONG AGES 55 TO 59 YEARS
100.0/ 100
METRIC RATING
23rd/ 347
METRIC RANK
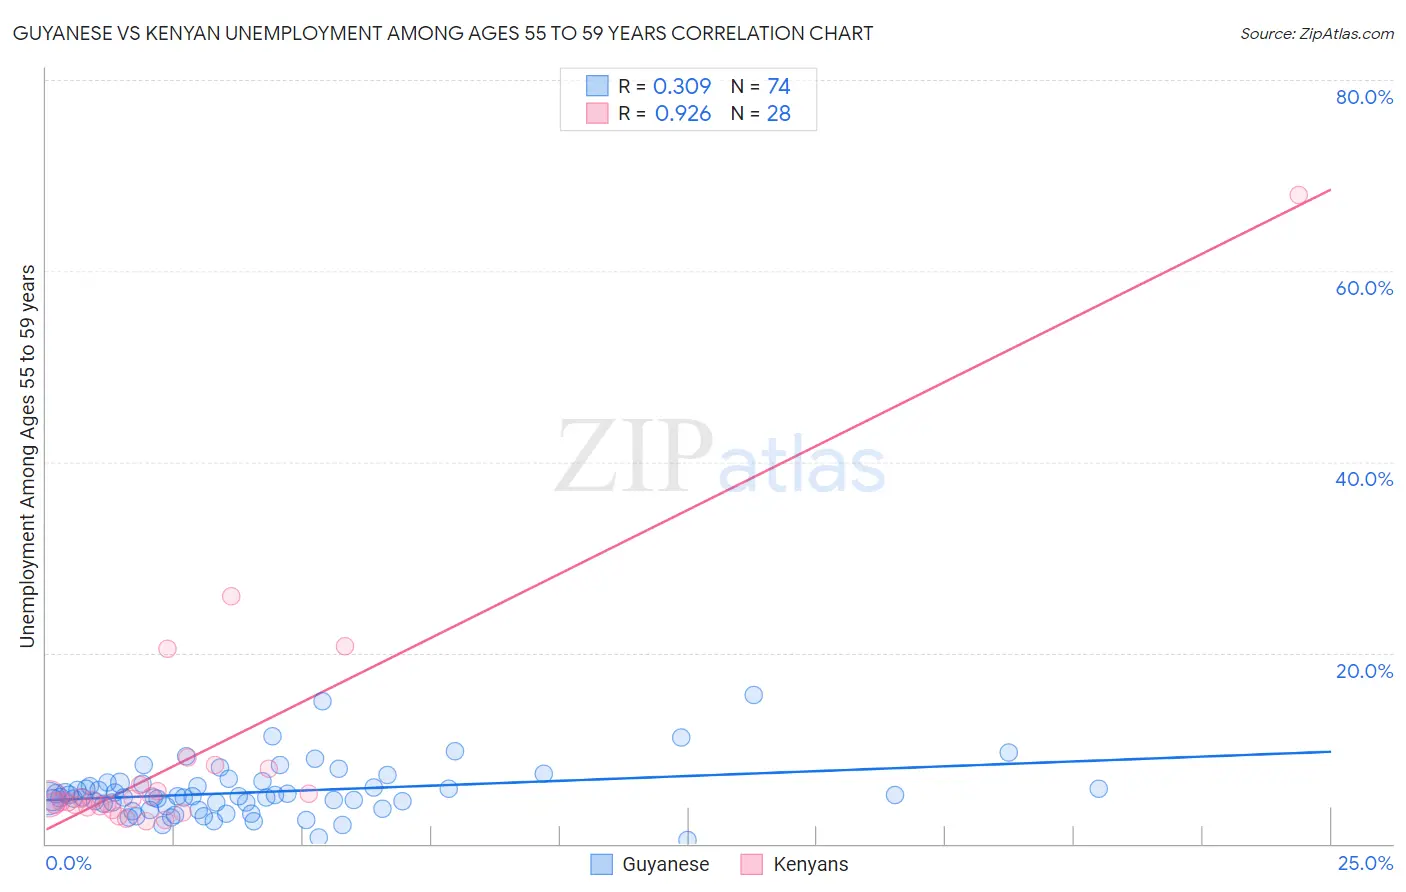
Guyanese vs Kenyan Unemployment Among Ages 55 to 59 years Correlation Chart
The statistical analysis conducted on geographies consisting of 171,113,003 people shows a mild positive correlation between the proportion of Guyanese and unemployment rate among population between the ages 55 and 59 in the United States with a correlation coefficient (R) of 0.309 and weighted average of 5.7%. Similarly, the statistical analysis conducted on geographies consisting of 163,555,444 people shows a near-perfect positive correlation between the proportion of Kenyans and unemployment rate among population between the ages 55 and 59 in the United States with a correlation coefficient (R) of 0.926 and weighted average of 4.4%, a difference of 28.0%.
Unemployment Among Ages 55 to 59 years Correlation Summary
| Measurement | Guyanese | Kenyan |
| Minimum | 0.40% | 2.4% |
| Maximum | 15.6% | 68.0% |
| Range | 15.2% | 65.6% |
| Mean | 5.4% | 8.8% |
| Median | 4.9% | 4.7% |
| Interquartile 25% (IQ1) | 3.9% | 3.9% |
| Interquartile 75% (IQ3) | 6.3% | 7.0% |
| Interquartile Range (IQR) | 2.4% | 3.1% |
| Standard Deviation (Sample) | 2.7% | 13.0% |
| Standard Deviation (Population) | 2.7% | 12.7% |
Similar Demographics by Unemployment Among Ages 55 to 59 years
Demographics Similar to Guyanese by Unemployment Among Ages 55 to 59 years
In terms of unemployment among ages 55 to 59 years, the demographic groups most similar to Guyanese are Tlingit-Haida (5.7%, a difference of 0.15%), Immigrants from Ecuador (5.7%, a difference of 0.20%), Hmong (5.7%, a difference of 0.42%), Central American Indian (5.6%, a difference of 0.44%), and Ecuadorian (5.6%, a difference of 0.63%).
| Demographics | Rating | Rank | Unemployment Among Ages 55 to 59 years |
| Spanish American Indians | 0.0 /100 | #308 | Tragic 5.6% |
| Nepalese | 0.0 /100 | #309 | Tragic 5.6% |
| Belizeans | 0.0 /100 | #310 | Tragic 5.6% |
| Houma | 0.0 /100 | #311 | Tragic 5.6% |
| Ecuadorians | 0.0 /100 | #312 | Tragic 5.6% |
| Central American Indians | 0.0 /100 | #313 | Tragic 5.6% |
| Tlingit-Haida | 0.0 /100 | #314 | Tragic 5.7% |
| Guyanese | 0.0 /100 | #315 | Tragic 5.7% |
| Immigrants | Ecuador | 0.0 /100 | #316 | Tragic 5.7% |
| Hmong | 0.0 /100 | #317 | Tragic 5.7% |
| Immigrants | Guyana | 0.0 /100 | #318 | Tragic 5.8% |
| Kiowa | 0.0 /100 | #319 | Tragic 5.8% |
| Immigrants | Azores | 0.0 /100 | #320 | Tragic 5.8% |
| Chippewa | 0.0 /100 | #321 | Tragic 5.9% |
| Crow | 0.0 /100 | #322 | Tragic 5.9% |
Demographics Similar to Kenyans by Unemployment Among Ages 55 to 59 years
In terms of unemployment among ages 55 to 59 years, the demographic groups most similar to Kenyans are Immigrants from Burma/Myanmar (4.4%, a difference of 0.25%), Jordanian (4.4%, a difference of 0.29%), Immigrants from Eritrea (4.4%, a difference of 0.30%), Puget Sound Salish (4.4%, a difference of 0.35%), and Scandinavian (4.5%, a difference of 0.47%).
| Demographics | Rating | Rank | Unemployment Among Ages 55 to 59 years |
| Somalis | 100.0 /100 | #16 | Exceptional 4.4% |
| Czechs | 100.0 /100 | #17 | Exceptional 4.4% |
| Immigrants | Somalia | 100.0 /100 | #18 | Exceptional 4.4% |
| Chinese | 100.0 /100 | #19 | Exceptional 4.4% |
| Swedes | 100.0 /100 | #20 | Exceptional 4.4% |
| Puget Sound Salish | 100.0 /100 | #21 | Exceptional 4.4% |
| Immigrants | Burma/Myanmar | 100.0 /100 | #22 | Exceptional 4.4% |
| Kenyans | 100.0 /100 | #23 | Exceptional 4.4% |
| Jordanians | 100.0 /100 | #24 | Exceptional 4.4% |
| Immigrants | Eritrea | 100.0 /100 | #25 | Exceptional 4.4% |
| Scandinavians | 99.9 /100 | #26 | Exceptional 4.5% |
| Immigrants | Zimbabwe | 99.9 /100 | #27 | Exceptional 4.5% |
| Immigrants | Eastern Africa | 99.9 /100 | #28 | Exceptional 4.5% |
| Palestinians | 99.9 /100 | #29 | Exceptional 4.5% |
| Immigrants | Kenya | 99.9 /100 | #30 | Exceptional 4.5% |