Guyanese vs Kenyan In Labor Force | Age > 16
COMPARE
Guyanese
Kenyan
In Labor Force | Age > 16
In Labor Force | Age > 16 Comparison
Guyanese
Kenyans
64.1%
IN LABOR FORCE | AGE > 16
0.4/ 100
METRIC RATING
270th/ 347
METRIC RANK
67.6%
IN LABOR FORCE | AGE > 16
100.0/ 100
METRIC RATING
19th/ 347
METRIC RANK
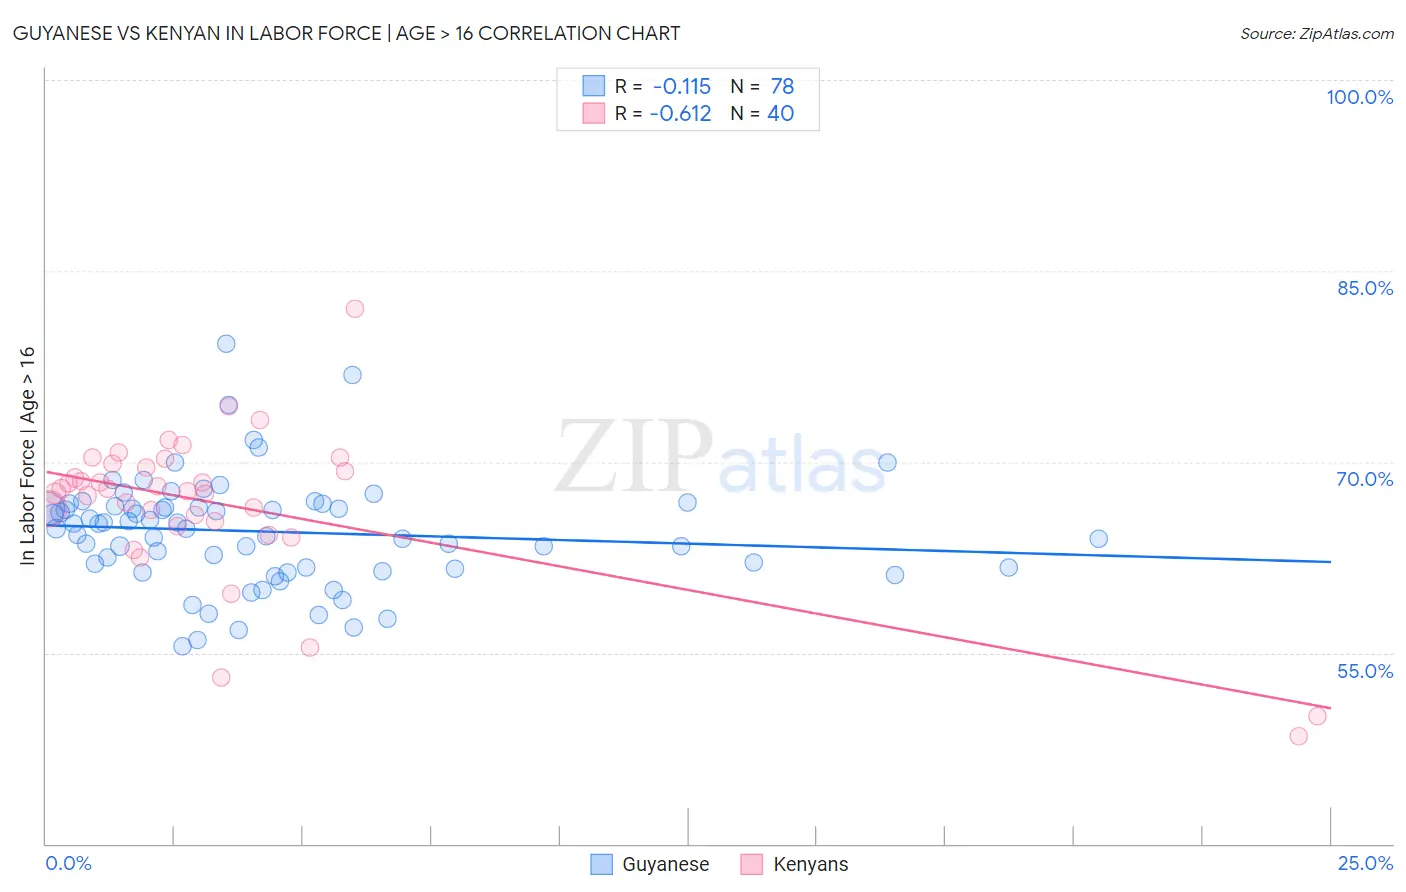
Guyanese vs Kenyan In Labor Force | Age > 16 Correlation Chart
The statistical analysis conducted on geographies consisting of 176,935,808 people shows a poor negative correlation between the proportion of Guyanese and labor force participation rate among population ages 16 and over in the United States with a correlation coefficient (R) of -0.115 and weighted average of 64.1%. Similarly, the statistical analysis conducted on geographies consisting of 168,242,512 people shows a significant negative correlation between the proportion of Kenyans and labor force participation rate among population ages 16 and over in the United States with a correlation coefficient (R) of -0.612 and weighted average of 67.6%, a difference of 5.4%.
In Labor Force | Age > 16 Correlation Summary
| Measurement | Guyanese | Kenyan |
| Minimum | 55.5% | 48.4% |
| Maximum | 79.3% | 82.0% |
| Range | 23.8% | 33.6% |
| Mean | 64.5% | 66.5% |
| Median | 64.9% | 67.8% |
| Interquartile 25% (IQ1) | 61.7% | 65.1% |
| Interquartile 75% (IQ3) | 66.5% | 69.7% |
| Interquartile Range (IQR) | 4.8% | 4.6% |
| Standard Deviation (Sample) | 4.3% | 6.2% |
| Standard Deviation (Population) | 4.3% | 6.1% |
Similar Demographics by In Labor Force | Age > 16
Demographics Similar to Guyanese by In Labor Force | Age > 16
In terms of in labor force | age > 16, the demographic groups most similar to Guyanese are Dominican (64.1%, a difference of 0.0%), Irish (64.1%, a difference of 0.030%), Native Hawaiian (64.1%, a difference of 0.030%), Hmong (64.1%, a difference of 0.030%), and Immigrants from Cuba (64.1%, a difference of 0.050%).
| Demographics | Rating | Rank | In Labor Force | Age > 16 |
| Bahamians | 0.6 /100 | #263 | Tragic 64.2% |
| Dutch | 0.6 /100 | #264 | Tragic 64.2% |
| Cubans | 0.5 /100 | #265 | Tragic 64.2% |
| Immigrants | England | 0.5 /100 | #266 | Tragic 64.2% |
| Canadians | 0.5 /100 | #267 | Tragic 64.1% |
| Spaniards | 0.5 /100 | #268 | Tragic 64.1% |
| Irish | 0.4 /100 | #269 | Tragic 64.1% |
| Guyanese | 0.4 /100 | #270 | Tragic 64.1% |
| Dominicans | 0.4 /100 | #271 | Tragic 64.1% |
| Native Hawaiians | 0.3 /100 | #272 | Tragic 64.1% |
| Hmong | 0.3 /100 | #273 | Tragic 64.1% |
| Immigrants | Cuba | 0.3 /100 | #274 | Tragic 64.1% |
| Mexicans | 0.3 /100 | #275 | Tragic 64.1% |
| French American Indians | 0.3 /100 | #276 | Tragic 64.1% |
| Immigrants | Bahamas | 0.3 /100 | #277 | Tragic 64.0% |
Demographics Similar to Kenyans by In Labor Force | Age > 16
In terms of in labor force | age > 16, the demographic groups most similar to Kenyans are Immigrants from Liberia (67.6%, a difference of 0.040%), Immigrants from India (67.6%, a difference of 0.050%), Immigrants from Kenya (67.6%, a difference of 0.050%), Tongan (67.5%, a difference of 0.070%), and Immigrants from Sudan (67.7%, a difference of 0.13%).
| Demographics | Rating | Rank | In Labor Force | Age > 16 |
| Sudanese | 100.0 /100 | #12 | Exceptional 68.0% |
| Immigrants | Nepal | 100.0 /100 | #13 | Exceptional 68.0% |
| Liberians | 100.0 /100 | #14 | Exceptional 67.8% |
| Immigrants | Middle Africa | 100.0 /100 | #15 | Exceptional 67.7% |
| Immigrants | Sudan | 100.0 /100 | #16 | Exceptional 67.7% |
| Immigrants | India | 100.0 /100 | #17 | Exceptional 67.6% |
| Immigrants | Liberia | 100.0 /100 | #18 | Exceptional 67.6% |
| Kenyans | 100.0 /100 | #19 | Exceptional 67.6% |
| Immigrants | Kenya | 100.0 /100 | #20 | Exceptional 67.6% |
| Tongans | 100.0 /100 | #21 | Exceptional 67.5% |
| Immigrants | Uganda | 100.0 /100 | #22 | Exceptional 67.5% |
| Cambodians | 100.0 /100 | #23 | Exceptional 67.4% |
| Ugandans | 100.0 /100 | #24 | Exceptional 67.4% |
| Immigrants | Africa | 100.0 /100 | #25 | Exceptional 67.4% |
| Immigrants | Cabo Verde | 100.0 /100 | #26 | Exceptional 67.3% |