Immigrants from Morocco vs New Zealander Disability Age 65 to 74
COMPARE
Immigrants from Morocco
New Zealander
Disability Age 65 to 74
Disability Age 65 to 74 Comparison
Immigrants from Morocco
New Zealanders
22.9%
DISABILITY AGE 65 TO 74
77.6/ 100
METRIC RATING
151st/ 347
METRIC RANK
22.9%
DISABILITY AGE 65 TO 74
79.9/ 100
METRIC RATING
148th/ 347
METRIC RANK
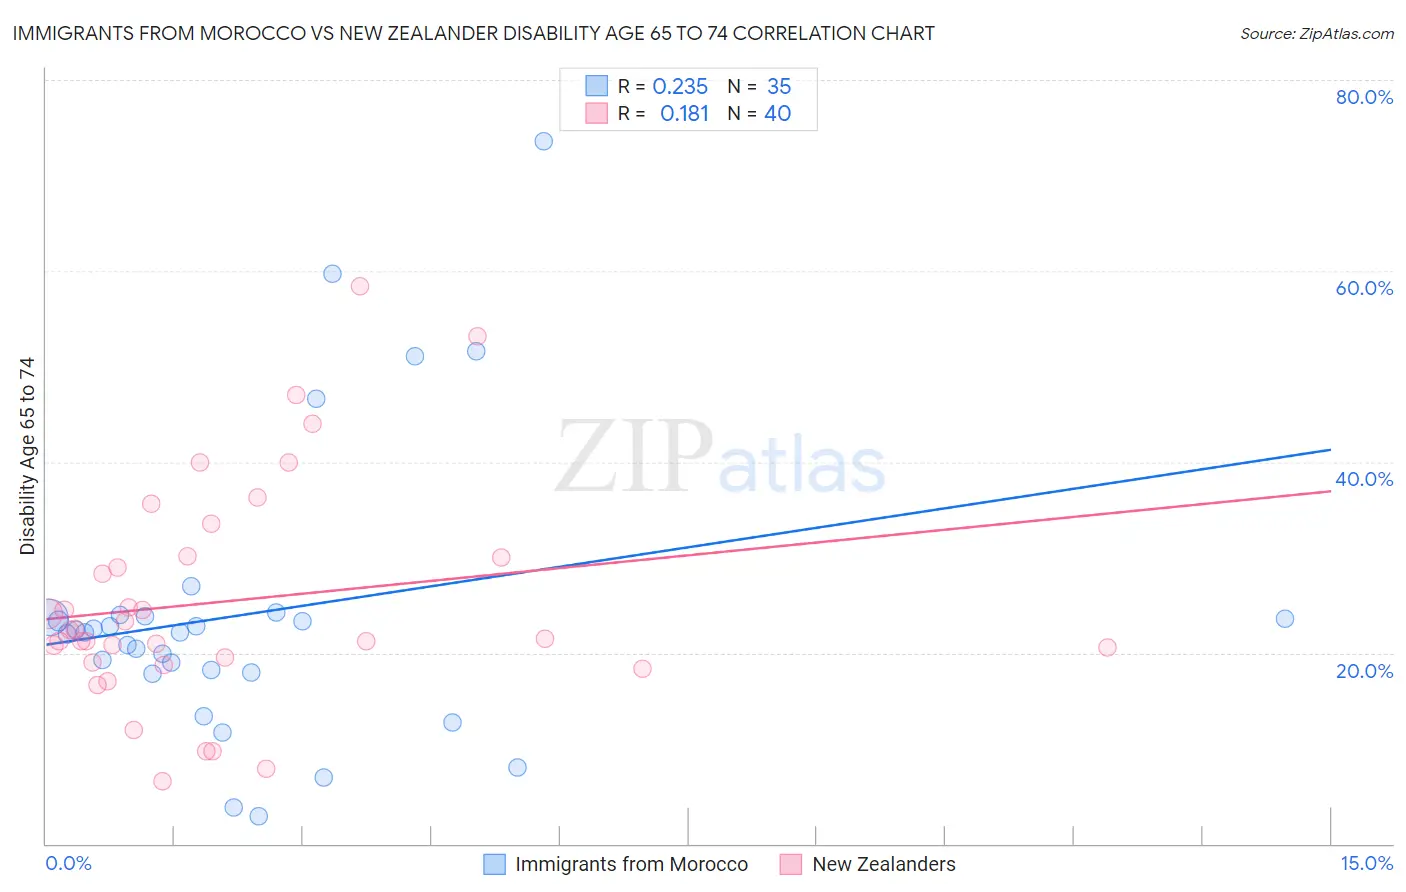
Immigrants from Morocco vs New Zealander Disability Age 65 to 74 Correlation Chart
The statistical analysis conducted on geographies consisting of 178,856,303 people shows a weak positive correlation between the proportion of Immigrants from Morocco and percentage of population with a disability between the ages 65 and 75 in the United States with a correlation coefficient (R) of 0.235 and weighted average of 22.9%. Similarly, the statistical analysis conducted on geographies consisting of 106,853,800 people shows a poor positive correlation between the proportion of New Zealanders and percentage of population with a disability between the ages 65 and 75 in the United States with a correlation coefficient (R) of 0.181 and weighted average of 22.9%, a difference of 0.20%.
Disability Age 65 to 74 Correlation Summary
| Measurement | Immigrants from Morocco | New Zealander |
| Minimum | 2.9% | 6.6% |
| Maximum | 73.6% | 58.3% |
| Range | 70.7% | 51.8% |
| Mean | 24.1% | 25.4% |
| Median | 22.1% | 21.9% |
| Interquartile 25% (IQ1) | 17.9% | 19.2% |
| Interquartile 75% (IQ3) | 23.9% | 30.1% |
| Interquartile Range (IQR) | 6.0% | 10.8% |
| Standard Deviation (Sample) | 15.1% | 11.7% |
| Standard Deviation (Population) | 14.9% | 11.5% |
Demographics Similar to Immigrants from Morocco and New Zealanders by Disability Age 65 to 74
In terms of disability age 65 to 74, the demographic groups most similar to Immigrants from Morocco are Canadian (22.9%, a difference of 0.0%), Finnish (22.9%, a difference of 0.090%), Swiss (22.9%, a difference of 0.18%), Slavic (23.0%, a difference of 0.20%), and Sri Lankan (23.0%, a difference of 0.29%). Similarly, the demographic groups most similar to New Zealanders are Swiss (22.9%, a difference of 0.020%), Canadian (22.9%, a difference of 0.20%), Finnish (22.9%, a difference of 0.29%), Immigrants from Uzbekistan (22.8%, a difference of 0.32%), and Alsatian (22.8%, a difference of 0.39%).
| Demographics | Rating | Rank | Disability Age 65 to 74 |
| Immigrants | Syria | 85.8 /100 | #139 | Excellent 22.7% |
| Ugandans | 85.4 /100 | #140 | Excellent 22.7% |
| Belgians | 85.3 /100 | #141 | Excellent 22.7% |
| Immigrants | Ethiopia | 85.3 /100 | #142 | Excellent 22.7% |
| Arabs | 84.8 /100 | #143 | Excellent 22.8% |
| Danes | 84.4 /100 | #144 | Excellent 22.8% |
| Immigrants | Uganda | 84.0 /100 | #145 | Excellent 22.8% |
| Alsatians | 83.7 /100 | #146 | Excellent 22.8% |
| Immigrants | Uzbekistan | 83.1 /100 | #147 | Excellent 22.8% |
| New Zealanders | 79.9 /100 | #148 | Good 22.9% |
| Swiss | 79.7 /100 | #149 | Good 22.9% |
| Canadians | 77.7 /100 | #150 | Good 22.9% |
| Immigrants | Morocco | 77.6 /100 | #151 | Good 22.9% |
| Finns | 76.5 /100 | #152 | Good 22.9% |
| Slavs | 75.2 /100 | #153 | Good 23.0% |
| Sri Lankans | 74.0 /100 | #154 | Good 23.0% |
| British | 73.9 /100 | #155 | Good 23.0% |
| Immigrants | Western Asia | 73.8 /100 | #156 | Good 23.0% |
| Czechoslovakians | 72.4 /100 | #157 | Good 23.0% |
| Immigrants | Vietnam | 69.1 /100 | #158 | Good 23.1% |
| South American Indians | 65.5 /100 | #159 | Good 23.1% |