Immigrants from Zaire vs New Zealander Disability Age 65 to 74
COMPARE
Immigrants from Zaire
New Zealander
Disability Age 65 to 74
Disability Age 65 to 74 Comparison
Immigrants from Zaire
New Zealanders
24.3%
DISABILITY AGE 65 TO 74
5.0/ 100
METRIC RATING
232nd/ 347
METRIC RANK
22.9%
DISABILITY AGE 65 TO 74
79.9/ 100
METRIC RATING
148th/ 347
METRIC RANK
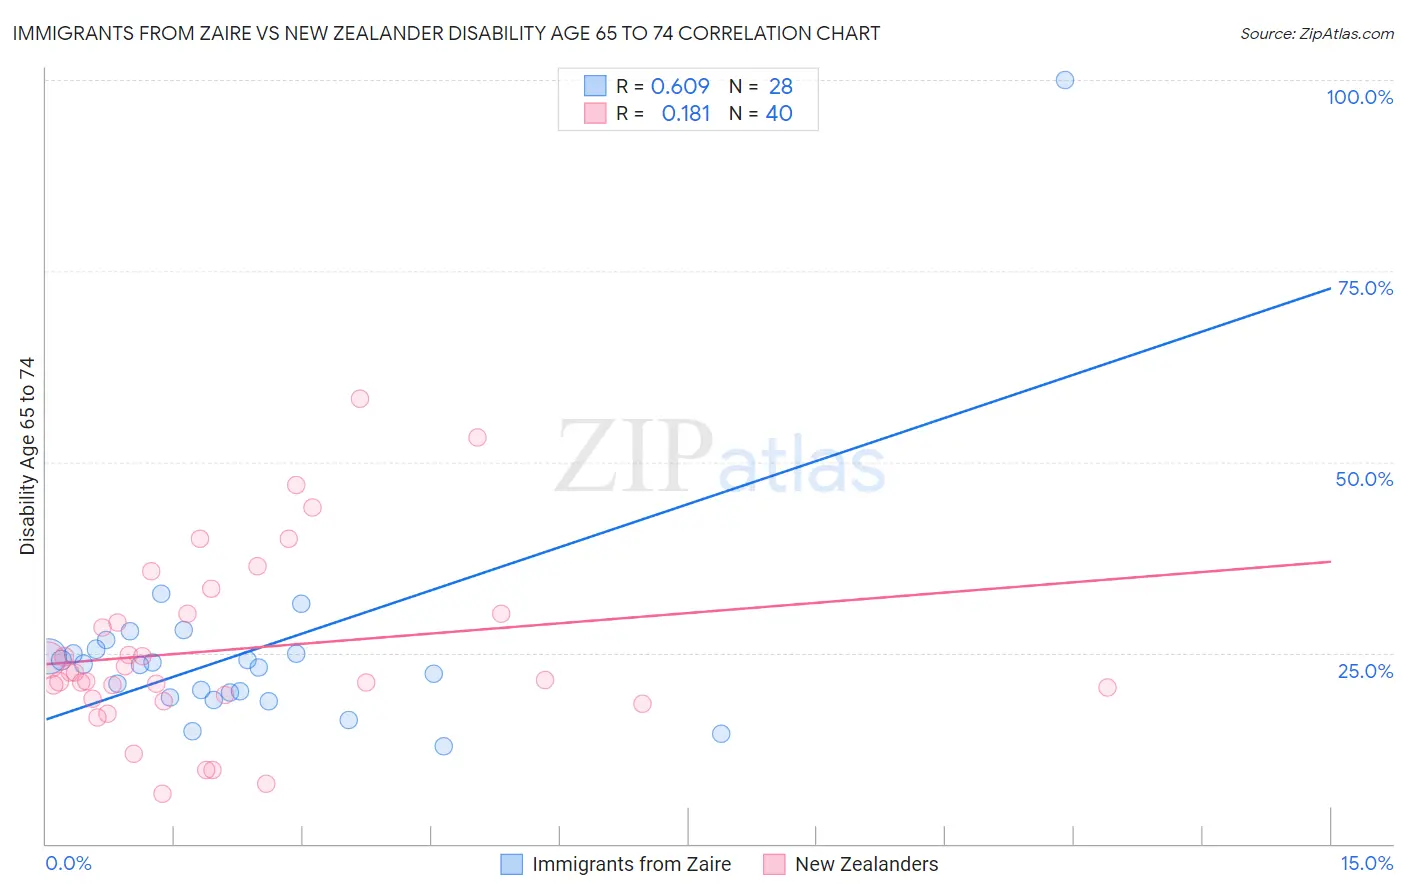
Immigrants from Zaire vs New Zealander Disability Age 65 to 74 Correlation Chart
The statistical analysis conducted on geographies consisting of 107,234,290 people shows a significant positive correlation between the proportion of Immigrants from Zaire and percentage of population with a disability between the ages 65 and 75 in the United States with a correlation coefficient (R) of 0.609 and weighted average of 24.3%. Similarly, the statistical analysis conducted on geographies consisting of 106,853,800 people shows a poor positive correlation between the proportion of New Zealanders and percentage of population with a disability between the ages 65 and 75 in the United States with a correlation coefficient (R) of 0.181 and weighted average of 22.9%, a difference of 6.4%.
Disability Age 65 to 74 Correlation Summary
| Measurement | Immigrants from Zaire | New Zealander |
| Minimum | 12.7% | 6.6% |
| Maximum | 100.0% | 58.3% |
| Range | 87.3% | 51.8% |
| Mean | 25.2% | 25.4% |
| Median | 23.5% | 21.9% |
| Interquartile 25% (IQ1) | 19.5% | 19.2% |
| Interquartile 75% (IQ3) | 25.1% | 30.1% |
| Interquartile Range (IQR) | 5.7% | 10.8% |
| Standard Deviation (Sample) | 15.4% | 11.7% |
| Standard Deviation (Population) | 15.1% | 11.5% |
Similar Demographics by Disability Age 65 to 74
Demographics Similar to Immigrants from Zaire by Disability Age 65 to 74
In terms of disability age 65 to 74, the demographic groups most similar to Immigrants from Zaire are Immigrants from Thailand (24.3%, a difference of 0.050%), Bahamian (24.4%, a difference of 0.16%), Barbadian (24.3%, a difference of 0.25%), Panamanian (24.4%, a difference of 0.27%), and Celtic (24.2%, a difference of 0.36%).
| Demographics | Rating | Rank | Disability Age 65 to 74 |
| Bermudans | 8.2 /100 | #225 | Tragic 24.2% |
| Iraqis | 8.1 /100 | #226 | Tragic 24.2% |
| Nigerians | 7.8 /100 | #227 | Tragic 24.2% |
| Whites/Caucasians | 6.6 /100 | #228 | Tragic 24.2% |
| Celtics | 6.4 /100 | #229 | Tragic 24.2% |
| Barbadians | 6.0 /100 | #230 | Tragic 24.3% |
| Immigrants | Thailand | 5.2 /100 | #231 | Tragic 24.3% |
| Immigrants | Zaire | 5.0 /100 | #232 | Tragic 24.3% |
| Bahamians | 4.5 /100 | #233 | Tragic 24.4% |
| Panamanians | 4.2 /100 | #234 | Tragic 24.4% |
| Scotch-Irish | 3.8 /100 | #235 | Tragic 24.4% |
| German Russians | 3.7 /100 | #236 | Tragic 24.4% |
| West Indians | 3.4 /100 | #237 | Tragic 24.5% |
| Immigrants | Ghana | 3.0 /100 | #238 | Tragic 24.5% |
| Immigrants | Caribbean | 2.6 /100 | #239 | Tragic 24.6% |
Demographics Similar to New Zealanders by Disability Age 65 to 74
In terms of disability age 65 to 74, the demographic groups most similar to New Zealanders are Swiss (22.9%, a difference of 0.020%), Canadian (22.9%, a difference of 0.20%), Immigrants from Morocco (22.9%, a difference of 0.20%), Finnish (22.9%, a difference of 0.29%), and Immigrants from Uzbekistan (22.8%, a difference of 0.32%).
| Demographics | Rating | Rank | Disability Age 65 to 74 |
| Belgians | 85.3 /100 | #141 | Excellent 22.7% |
| Immigrants | Ethiopia | 85.3 /100 | #142 | Excellent 22.7% |
| Arabs | 84.8 /100 | #143 | Excellent 22.8% |
| Danes | 84.4 /100 | #144 | Excellent 22.8% |
| Immigrants | Uganda | 84.0 /100 | #145 | Excellent 22.8% |
| Alsatians | 83.7 /100 | #146 | Excellent 22.8% |
| Immigrants | Uzbekistan | 83.1 /100 | #147 | Excellent 22.8% |
| New Zealanders | 79.9 /100 | #148 | Good 22.9% |
| Swiss | 79.7 /100 | #149 | Good 22.9% |
| Canadians | 77.7 /100 | #150 | Good 22.9% |
| Immigrants | Morocco | 77.6 /100 | #151 | Good 22.9% |
| Finns | 76.5 /100 | #152 | Good 22.9% |
| Slavs | 75.2 /100 | #153 | Good 23.0% |
| Sri Lankans | 74.0 /100 | #154 | Good 23.0% |
| British | 73.9 /100 | #155 | Good 23.0% |