Guamanian/Chamorro vs Immigrants from Ghana Doctorate Degree
COMPARE
Guamanian/Chamorro
Immigrants from Ghana
Doctorate Degree
Doctorate Degree Comparison
Guamanians/Chamorros
Immigrants from Ghana
1.6%
DOCTORATE DEGREE
3.3/ 100
METRIC RATING
232nd/ 347
METRIC RANK
1.8%
DOCTORATE DEGREE
24.6/ 100
METRIC RATING
198th/ 347
METRIC RANK
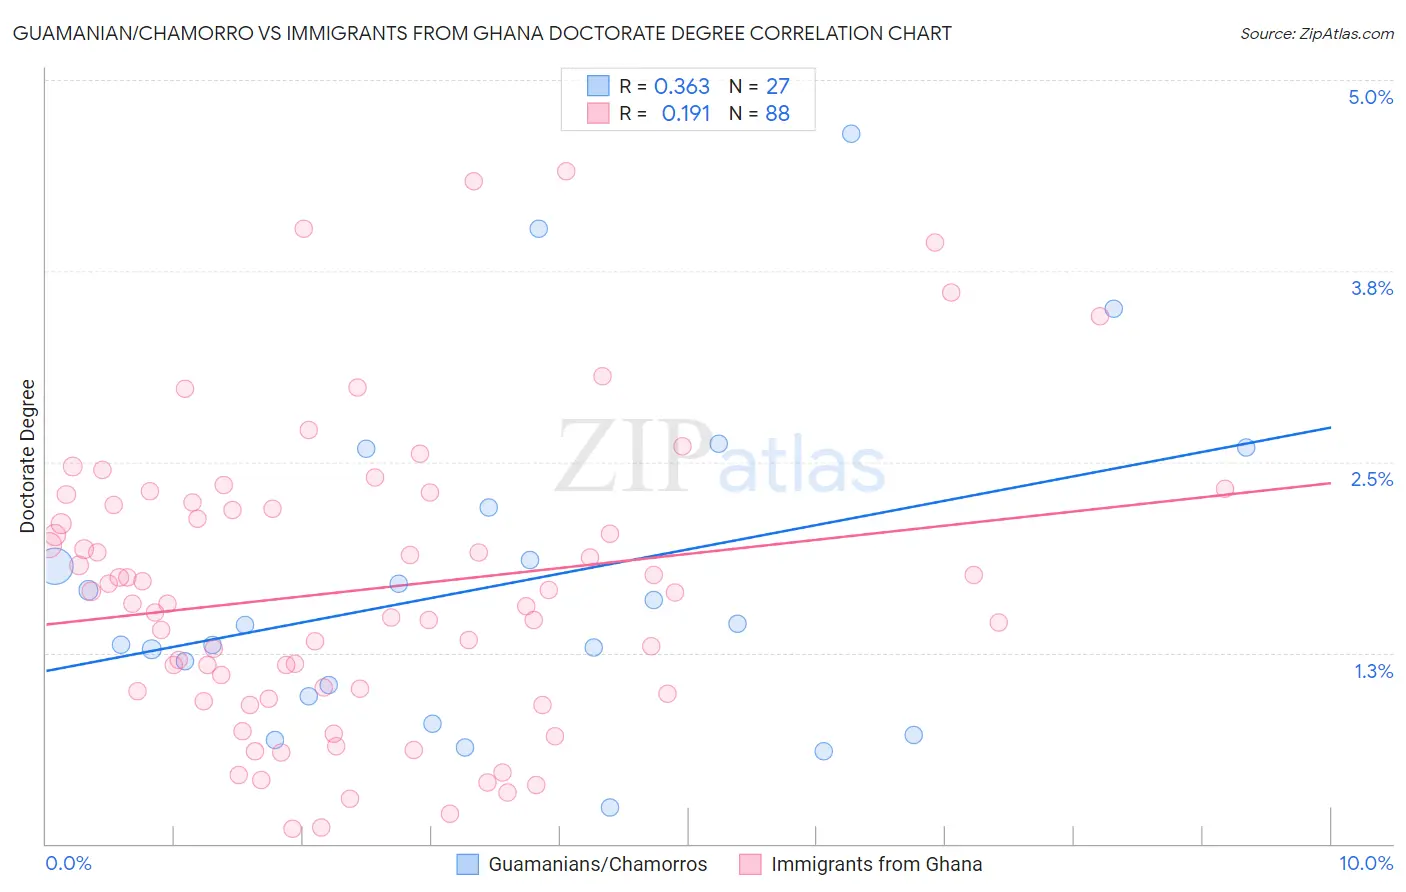
Guamanian/Chamorro vs Immigrants from Ghana Doctorate Degree Correlation Chart
The statistical analysis conducted on geographies consisting of 220,575,272 people shows a mild positive correlation between the proportion of Guamanians/Chamorros and percentage of population with at least doctorate degree education in the United States with a correlation coefficient (R) of 0.363 and weighted average of 1.6%. Similarly, the statistical analysis conducted on geographies consisting of 199,222,396 people shows a poor positive correlation between the proportion of Immigrants from Ghana and percentage of population with at least doctorate degree education in the United States with a correlation coefficient (R) of 0.191 and weighted average of 1.8%, a difference of 9.4%.
Doctorate Degree Correlation Summary
| Measurement | Guamanian/Chamorro | Immigrants from Ghana |
| Minimum | 0.23% | 0.098% |
| Maximum | 4.6% | 4.4% |
| Range | 4.4% | 4.3% |
| Mean | 1.7% | 1.7% |
| Median | 1.4% | 1.6% |
| Interquartile 25% (IQ1) | 0.97% | 0.99% |
| Interquartile 75% (IQ3) | 2.2% | 2.2% |
| Interquartile Range (IQR) | 1.2% | 1.2% |
| Standard Deviation (Sample) | 1.1% | 0.95% |
| Standard Deviation (Population) | 1.0% | 0.94% |
Similar Demographics by Doctorate Degree
Demographics Similar to Guamanians/Chamorros by Doctorate Degree
In terms of doctorate degree, the demographic groups most similar to Guamanians/Chamorros are Barbadian (1.6%, a difference of 0.070%), Hopi (1.6%, a difference of 0.21%), Cree (1.6%, a difference of 0.43%), Immigrants from North Macedonia (1.6%, a difference of 0.69%), and Indonesian (1.6%, a difference of 0.71%).
| Demographics | Rating | Rank | Doctorate Degree |
| Immigrants | Colombia | 6.7 /100 | #225 | Tragic 1.7% |
| Osage | 6.5 /100 | #226 | Tragic 1.7% |
| Panamanians | 6.3 /100 | #227 | Tragic 1.7% |
| Assyrians/Chaldeans/Syriacs | 5.9 /100 | #228 | Tragic 1.7% |
| Colville | 4.7 /100 | #229 | Tragic 1.6% |
| Immigrants | Philippines | 4.3 /100 | #230 | Tragic 1.6% |
| Immigrants | North Macedonia | 3.9 /100 | #231 | Tragic 1.6% |
| Guamanians/Chamorros | 3.3 /100 | #232 | Tragic 1.6% |
| Barbadians | 3.3 /100 | #233 | Tragic 1.6% |
| Hopi | 3.2 /100 | #234 | Tragic 1.6% |
| Cree | 3.0 /100 | #235 | Tragic 1.6% |
| Indonesians | 2.8 /100 | #236 | Tragic 1.6% |
| Iroquois | 2.7 /100 | #237 | Tragic 1.6% |
| Immigrants | Congo | 2.6 /100 | #238 | Tragic 1.6% |
| West Indians | 2.5 /100 | #239 | Tragic 1.6% |
Demographics Similar to Immigrants from Ghana by Doctorate Degree
In terms of doctorate degree, the demographic groups most similar to Immigrants from Ghana are Chinese (1.8%, a difference of 0.080%), Subsaharan African (1.8%, a difference of 0.090%), Immigrants from Somalia (1.8%, a difference of 0.16%), Immigrants from South America (1.8%, a difference of 0.29%), and Uruguayan (1.8%, a difference of 0.31%).
| Demographics | Rating | Rank | Doctorate Degree |
| South Americans | 29.5 /100 | #191 | Fair 1.8% |
| Dutch | 27.4 /100 | #192 | Fair 1.8% |
| German Russians | 27.1 /100 | #193 | Fair 1.8% |
| Uruguayans | 26.2 /100 | #194 | Fair 1.8% |
| Immigrants | Somalia | 25.4 /100 | #195 | Fair 1.8% |
| Sub-Saharan Africans | 25.1 /100 | #196 | Fair 1.8% |
| Chinese | 25.1 /100 | #197 | Fair 1.8% |
| Immigrants | Ghana | 24.6 /100 | #198 | Fair 1.8% |
| Immigrants | South America | 23.3 /100 | #199 | Fair 1.8% |
| Whites/Caucasians | 22.8 /100 | #200 | Fair 1.8% |
| Immigrants | Nigeria | 22.4 /100 | #201 | Fair 1.8% |
| Portuguese | 21.4 /100 | #202 | Fair 1.8% |
| Immigrants | Vietnam | 21.4 /100 | #203 | Fair 1.8% |
| Somalis | 21.2 /100 | #204 | Fair 1.7% |
| Venezuelans | 19.5 /100 | #205 | Poor 1.7% |