Immigrants from Sweden vs Immigrants from Croatia Disability
COMPARE
Immigrants from Sweden
Immigrants from Croatia
Disability
Disability Comparison
Immigrants from Sweden
Immigrants from Croatia
11.0%
DISABILITY
99.6/ 100
METRIC RATING
64th/ 347
METRIC RANK
11.4%
DISABILITY
89.8/ 100
METRIC RATING
131st/ 347
METRIC RANK
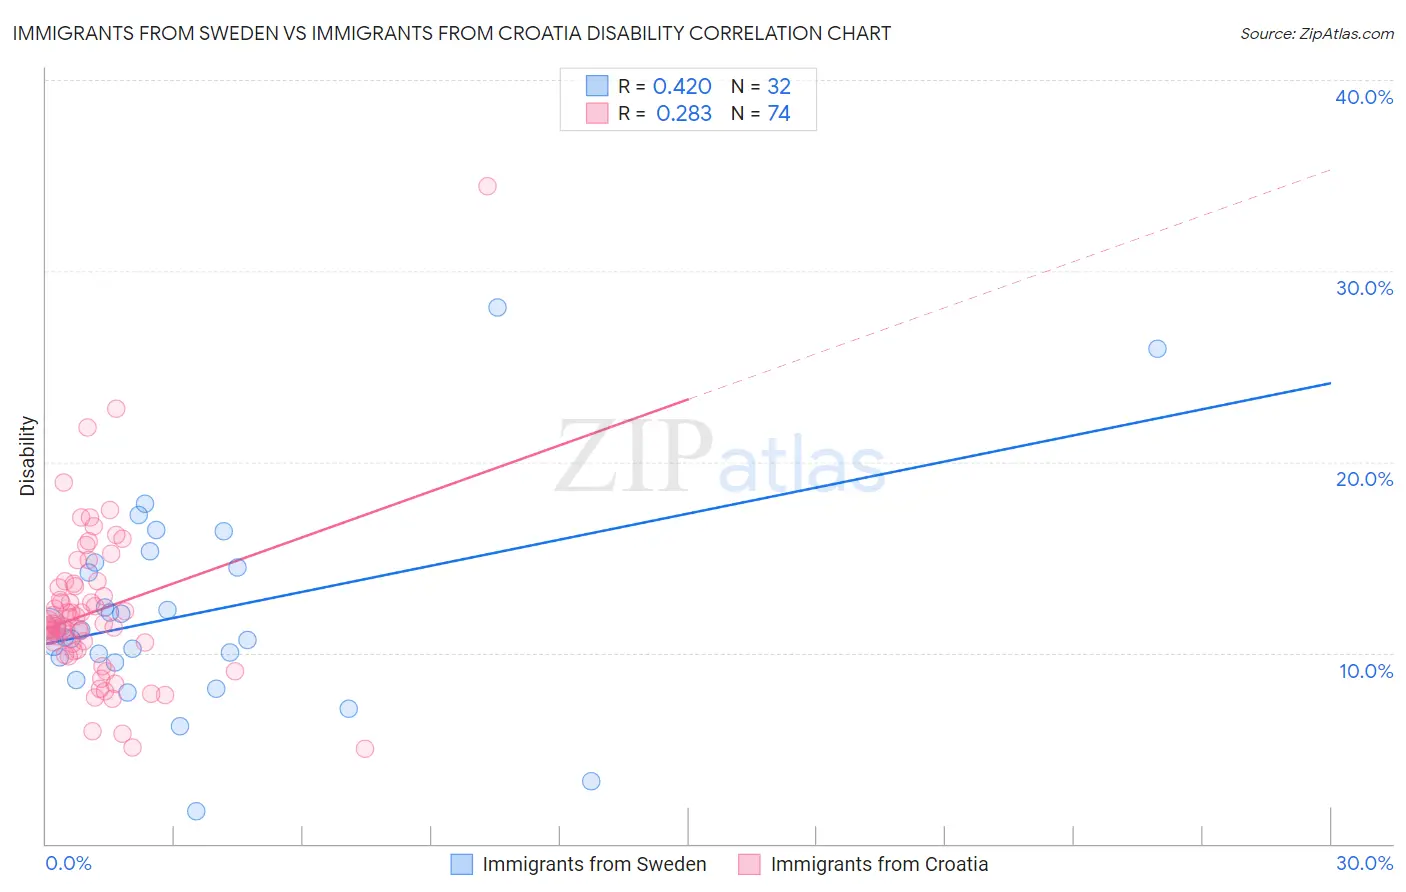
Immigrants from Sweden vs Immigrants from Croatia Disability Correlation Chart
The statistical analysis conducted on geographies consisting of 164,749,028 people shows a moderate positive correlation between the proportion of Immigrants from Sweden and percentage of population with a disability in the United States with a correlation coefficient (R) of 0.420 and weighted average of 11.0%. Similarly, the statistical analysis conducted on geographies consisting of 132,571,649 people shows a weak positive correlation between the proportion of Immigrants from Croatia and percentage of population with a disability in the United States with a correlation coefficient (R) of 0.283 and weighted average of 11.4%, a difference of 4.1%.
Disability Correlation Summary
| Measurement | Immigrants from Sweden | Immigrants from Croatia |
| Minimum | 1.7% | 5.0% |
| Maximum | 28.1% | 34.4% |
| Range | 26.4% | 29.5% |
| Mean | 12.1% | 12.2% |
| Median | 11.0% | 11.5% |
| Interquartile 25% (IQ1) | 9.6% | 10.1% |
| Interquartile 75% (IQ3) | 14.6% | 13.5% |
| Interquartile Range (IQR) | 4.9% | 3.4% |
| Standard Deviation (Sample) | 5.4% | 4.3% |
| Standard Deviation (Population) | 5.3% | 4.2% |
Similar Demographics by Disability
Demographics Similar to Immigrants from Sweden by Disability
In terms of disability, the demographic groups most similar to Immigrants from Sweden are Bulgarian (11.0%, a difference of 0.020%), Laotian (11.0%, a difference of 0.030%), Colombian (11.0%, a difference of 0.11%), Immigrants from Eritrea (11.0%, a difference of 0.18%), and Immigrants from Northern Africa (10.9%, a difference of 0.20%).
| Demographics | Rating | Rank | Disability |
| Salvadorans | 99.8 /100 | #57 | Exceptional 10.9% |
| Immigrants | South America | 99.8 /100 | #58 | Exceptional 10.9% |
| Immigrants | Colombia | 99.7 /100 | #59 | Exceptional 10.9% |
| Zimbabweans | 99.7 /100 | #60 | Exceptional 10.9% |
| Immigrants | Bulgaria | 99.7 /100 | #61 | Exceptional 10.9% |
| Immigrants | Northern Africa | 99.7 /100 | #62 | Exceptional 10.9% |
| Immigrants | Eritrea | 99.7 /100 | #63 | Exceptional 11.0% |
| Immigrants | Sweden | 99.6 /100 | #64 | Exceptional 11.0% |
| Bulgarians | 99.6 /100 | #65 | Exceptional 11.0% |
| Laotians | 99.6 /100 | #66 | Exceptional 11.0% |
| Colombians | 99.6 /100 | #67 | Exceptional 11.0% |
| Immigrants | Afghanistan | 99.6 /100 | #68 | Exceptional 11.0% |
| Sri Lankans | 99.5 /100 | #69 | Exceptional 11.0% |
| Immigrants | France | 99.4 /100 | #70 | Exceptional 11.0% |
| Immigrants | Lebanon | 99.4 /100 | #71 | Exceptional 11.0% |
Demographics Similar to Immigrants from Croatia by Disability
In terms of disability, the demographic groups most similar to Immigrants from Croatia are Latvian (11.4%, a difference of 0.010%), Macedonian (11.4%, a difference of 0.060%), Immigrants from Africa (11.4%, a difference of 0.060%), Immigrants from Italy (11.4%, a difference of 0.080%), and Immigrants from Europe (11.4%, a difference of 0.080%).
| Demographics | Rating | Rank | Disability |
| South American Indians | 92.2 /100 | #124 | Exceptional 11.4% |
| Costa Ricans | 91.9 /100 | #125 | Exceptional 11.4% |
| Immigrants | Latvia | 90.9 /100 | #126 | Exceptional 11.4% |
| Immigrants | Italy | 90.4 /100 | #127 | Exceptional 11.4% |
| Immigrants | Europe | 90.4 /100 | #128 | Exceptional 11.4% |
| Macedonians | 90.3 /100 | #129 | Exceptional 11.4% |
| Latvians | 89.8 /100 | #130 | Excellent 11.4% |
| Immigrants | Croatia | 89.8 /100 | #131 | Excellent 11.4% |
| Immigrants | Africa | 89.3 /100 | #132 | Excellent 11.4% |
| Arabs | 89.1 /100 | #133 | Excellent 11.4% |
| Immigrants | Guyana | 88.3 /100 | #134 | Excellent 11.4% |
| Ugandans | 87.9 /100 | #135 | Excellent 11.4% |
| Immigrants | St. Vincent and the Grenadines | 87.8 /100 | #136 | Excellent 11.4% |
| Kenyans | 87.1 /100 | #137 | Excellent 11.5% |
| New Zealanders | 87.0 /100 | #138 | Excellent 11.5% |