Salvadoran vs Ethiopian Disability Age Over 75
COMPARE
Salvadoran
Ethiopian
Disability Age Over 75
Disability Age Over 75 Comparison
Salvadorans
Ethiopians
48.9%
DISABILITY AGE OVER 75
0.3/ 100
METRIC RATING
263rd/ 347
METRIC RANK
46.8%
DISABILITY AGE OVER 75
88.9/ 100
METRIC RATING
135th/ 347
METRIC RANK
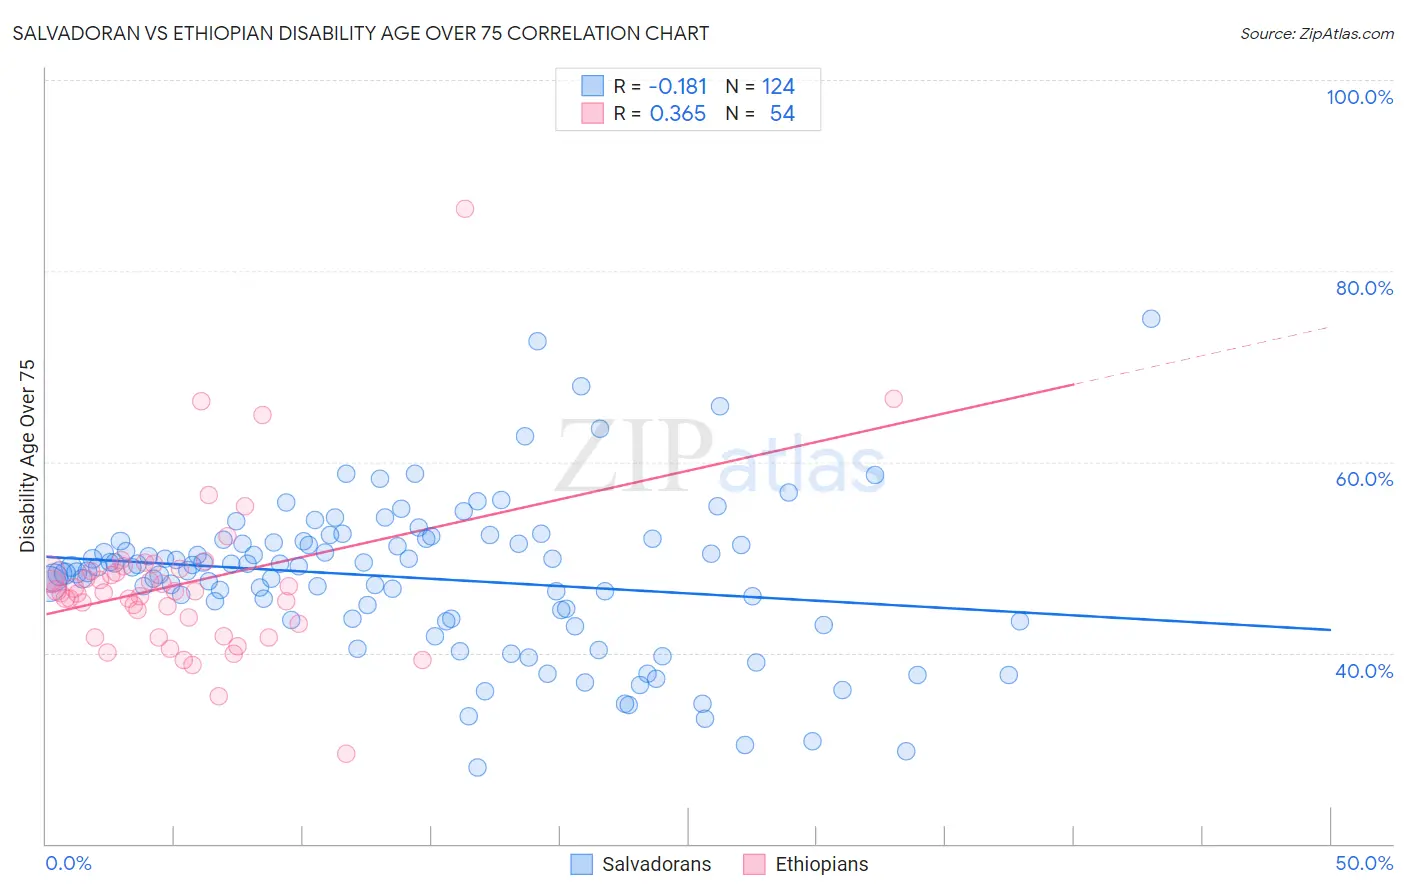
Salvadoran vs Ethiopian Disability Age Over 75 Correlation Chart
The statistical analysis conducted on geographies consisting of 398,055,900 people shows a poor negative correlation between the proportion of Salvadorans and percentage of population with a disability over the age of 75 in the United States with a correlation coefficient (R) of -0.181 and weighted average of 48.9%. Similarly, the statistical analysis conducted on geographies consisting of 222,925,097 people shows a mild positive correlation between the proportion of Ethiopians and percentage of population with a disability over the age of 75 in the United States with a correlation coefficient (R) of 0.365 and weighted average of 46.8%, a difference of 4.5%.
Disability Age Over 75 Correlation Summary
| Measurement | Salvadoran | Ethiopian |
| Minimum | 28.0% | 29.5% |
| Maximum | 75.0% | 86.5% |
| Range | 47.0% | 57.0% |
| Mean | 47.8% | 47.3% |
| Median | 49.0% | 46.4% |
| Interquartile 25% (IQ1) | 43.5% | 43.0% |
| Interquartile 75% (IQ3) | 51.7% | 48.6% |
| Interquartile Range (IQR) | 8.2% | 5.5% |
| Standard Deviation (Sample) | 8.1% | 8.5% |
| Standard Deviation (Population) | 8.0% | 8.4% |
Similar Demographics by Disability Age Over 75
Demographics Similar to Salvadorans by Disability Age Over 75
In terms of disability age over 75, the demographic groups most similar to Salvadorans are Immigrants from West Indies (48.9%, a difference of 0.020%), Immigrants from Honduras (48.9%, a difference of 0.050%), Honduran (48.9%, a difference of 0.060%), African (48.9%, a difference of 0.080%), and U.S. Virgin Islander (48.9%, a difference of 0.090%).
| Demographics | Rating | Rank | Disability Age Over 75 |
| Immigrants | Congo | 0.5 /100 | #256 | Tragic 48.7% |
| Blackfeet | 0.5 /100 | #257 | Tragic 48.8% |
| Immigrants | Philippines | 0.4 /100 | #258 | Tragic 48.8% |
| Central Americans | 0.4 /100 | #259 | Tragic 48.8% |
| Immigrants | Afghanistan | 0.4 /100 | #260 | Tragic 48.8% |
| Africans | 0.3 /100 | #261 | Tragic 48.9% |
| Immigrants | West Indies | 0.3 /100 | #262 | Tragic 48.9% |
| Salvadorans | 0.3 /100 | #263 | Tragic 48.9% |
| Immigrants | Honduras | 0.3 /100 | #264 | Tragic 48.9% |
| Hondurans | 0.3 /100 | #265 | Tragic 48.9% |
| U.S. Virgin Islanders | 0.2 /100 | #266 | Tragic 48.9% |
| Malaysians | 0.2 /100 | #267 | Tragic 49.0% |
| Guatemalans | 0.2 /100 | #268 | Tragic 49.0% |
| Immigrants | El Salvador | 0.2 /100 | #269 | Tragic 49.0% |
| Potawatomi | 0.2 /100 | #270 | Tragic 49.0% |
Demographics Similar to Ethiopians by Disability Age Over 75
In terms of disability age over 75, the demographic groups most similar to Ethiopians are Immigrants from Ethiopia (46.8%, a difference of 0.010%), Immigrants from Venezuela (46.8%, a difference of 0.010%), Immigrants from Uganda (46.8%, a difference of 0.020%), Immigrants from Bosnia and Herzegovina (46.8%, a difference of 0.020%), and Yugoslavian (46.8%, a difference of 0.020%).
| Demographics | Rating | Rank | Disability Age Over 75 |
| Icelanders | 90.9 /100 | #128 | Exceptional 46.7% |
| Immigrants | Germany | 90.8 /100 | #129 | Exceptional 46.7% |
| Immigrants | Northern Africa | 90.7 /100 | #130 | Exceptional 46.7% |
| Scottish | 90.5 /100 | #131 | Exceptional 46.7% |
| South Americans | 90.0 /100 | #132 | Excellent 46.8% |
| English | 89.4 /100 | #133 | Excellent 46.8% |
| Immigrants | Ethiopia | 89.1 /100 | #134 | Excellent 46.8% |
| Ethiopians | 88.9 /100 | #135 | Excellent 46.8% |
| Immigrants | Venezuela | 88.6 /100 | #136 | Excellent 46.8% |
| Immigrants | Uganda | 88.5 /100 | #137 | Excellent 46.8% |
| Immigrants | Bosnia and Herzegovina | 88.5 /100 | #138 | Excellent 46.8% |
| Yugoslavians | 88.5 /100 | #139 | Excellent 46.8% |
| Immigrants | Costa Rica | 87.4 /100 | #140 | Excellent 46.8% |
| Lebanese | 87.0 /100 | #141 | Excellent 46.8% |
| Peruvians | 86.5 /100 | #142 | Excellent 46.8% |