Immigrants from Ghana vs Ethiopian Disability Age Over 75
COMPARE
Immigrants from Ghana
Ethiopian
Disability Age Over 75
Disability Age Over 75 Comparison
Immigrants from Ghana
Ethiopians
47.7%
DISABILITY AGE OVER 75
19.1/ 100
METRIC RATING
205th/ 347
METRIC RANK
46.8%
DISABILITY AGE OVER 75
88.9/ 100
METRIC RATING
135th/ 347
METRIC RANK
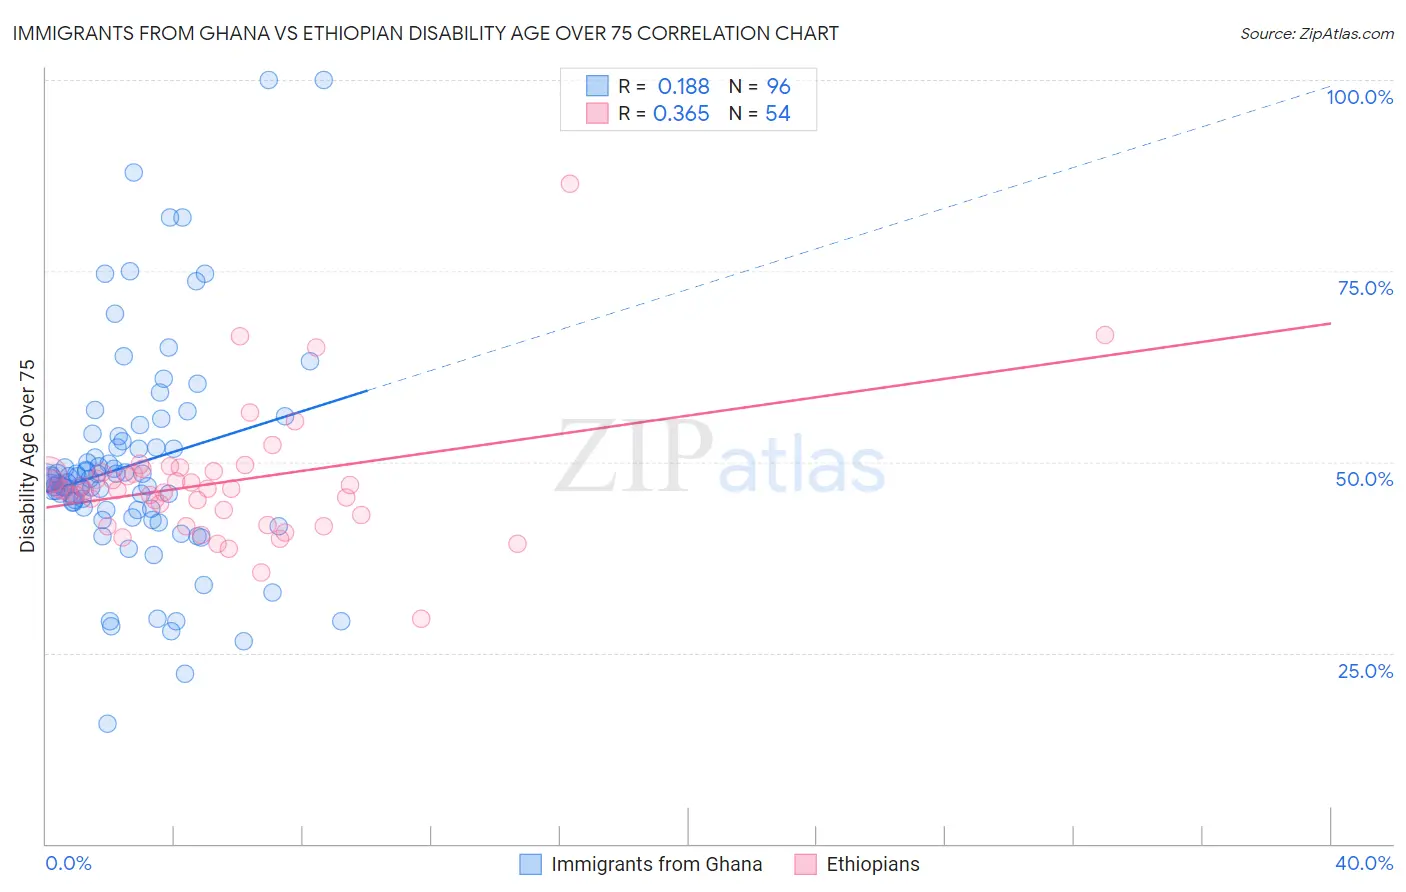
Immigrants from Ghana vs Ethiopian Disability Age Over 75 Correlation Chart
The statistical analysis conducted on geographies consisting of 199,494,871 people shows a poor positive correlation between the proportion of Immigrants from Ghana and percentage of population with a disability over the age of 75 in the United States with a correlation coefficient (R) of 0.188 and weighted average of 47.7%. Similarly, the statistical analysis conducted on geographies consisting of 222,925,097 people shows a mild positive correlation between the proportion of Ethiopians and percentage of population with a disability over the age of 75 in the United States with a correlation coefficient (R) of 0.365 and weighted average of 46.8%, a difference of 2.0%.
Disability Age Over 75 Correlation Summary
| Measurement | Immigrants from Ghana | Ethiopian |
| Minimum | 15.7% | 29.5% |
| Maximum | 100.0% | 86.5% |
| Range | 84.3% | 57.0% |
| Mean | 49.6% | 47.3% |
| Median | 47.4% | 46.4% |
| Interquartile 25% (IQ1) | 43.8% | 43.0% |
| Interquartile 75% (IQ3) | 52.3% | 48.6% |
| Interquartile Range (IQR) | 8.6% | 5.5% |
| Standard Deviation (Sample) | 14.4% | 8.5% |
| Standard Deviation (Population) | 14.3% | 8.4% |
Similar Demographics by Disability Age Over 75
Demographics Similar to Immigrants from Ghana by Disability Age Over 75
In terms of disability age over 75, the demographic groups most similar to Immigrants from Ghana are Jamaican (47.7%, a difference of 0.0%), Nigerian (47.7%, a difference of 0.010%), Trinidadian and Tobagonian (47.7%, a difference of 0.030%), Immigrants from Cuba (47.7%, a difference of 0.060%), and Immigrants from Bahamas (47.7%, a difference of 0.060%).
| Demographics | Rating | Rank | Disability Age Over 75 |
| Immigrants | Ukraine | 23.2 /100 | #198 | Fair 47.7% |
| Immigrants | Eritrea | 22.4 /100 | #199 | Fair 47.7% |
| Immigrants | Somalia | 21.4 /100 | #200 | Fair 47.7% |
| Immigrants | Cuba | 20.9 /100 | #201 | Fair 47.7% |
| Immigrants | Bahamas | 20.7 /100 | #202 | Fair 47.7% |
| Trinidadians and Tobagonians | 20.0 /100 | #203 | Fair 47.7% |
| Nigerians | 19.2 /100 | #204 | Poor 47.7% |
| Immigrants | Ghana | 19.1 /100 | #205 | Poor 47.7% |
| Jamaicans | 19.0 /100 | #206 | Poor 47.7% |
| Immigrants | Syria | 17.4 /100 | #207 | Poor 47.8% |
| Immigrants | Senegal | 16.9 /100 | #208 | Poor 47.8% |
| Immigrants | Indonesia | 14.2 /100 | #209 | Poor 47.8% |
| Vietnamese | 11.9 /100 | #210 | Poor 47.9% |
| Panamanians | 11.8 /100 | #211 | Poor 47.9% |
| Immigrants | Burma/Myanmar | 11.7 /100 | #212 | Poor 47.9% |
Demographics Similar to Ethiopians by Disability Age Over 75
In terms of disability age over 75, the demographic groups most similar to Ethiopians are Immigrants from Ethiopia (46.8%, a difference of 0.010%), Immigrants from Venezuela (46.8%, a difference of 0.010%), Immigrants from Uganda (46.8%, a difference of 0.020%), Immigrants from Bosnia and Herzegovina (46.8%, a difference of 0.020%), and Yugoslavian (46.8%, a difference of 0.020%).
| Demographics | Rating | Rank | Disability Age Over 75 |
| Icelanders | 90.9 /100 | #128 | Exceptional 46.7% |
| Immigrants | Germany | 90.8 /100 | #129 | Exceptional 46.7% |
| Immigrants | Northern Africa | 90.7 /100 | #130 | Exceptional 46.7% |
| Scottish | 90.5 /100 | #131 | Exceptional 46.7% |
| South Americans | 90.0 /100 | #132 | Excellent 46.8% |
| English | 89.4 /100 | #133 | Excellent 46.8% |
| Immigrants | Ethiopia | 89.1 /100 | #134 | Excellent 46.8% |
| Ethiopians | 88.9 /100 | #135 | Excellent 46.8% |
| Immigrants | Venezuela | 88.6 /100 | #136 | Excellent 46.8% |
| Immigrants | Uganda | 88.5 /100 | #137 | Excellent 46.8% |
| Immigrants | Bosnia and Herzegovina | 88.5 /100 | #138 | Excellent 46.8% |
| Yugoslavians | 88.5 /100 | #139 | Excellent 46.8% |
| Immigrants | Costa Rica | 87.4 /100 | #140 | Excellent 46.8% |
| Lebanese | 87.0 /100 | #141 | Excellent 46.8% |
| Peruvians | 86.5 /100 | #142 | Excellent 46.8% |