Guamanian/Chamorro vs Chinese Unemployment Among Seniors over 75 years
COMPARE
Guamanian/Chamorro
Chinese
Unemployment Among Seniors over 75 years
Unemployment Among Seniors over 75 years Comparison
Guamanians/Chamorros
Chinese
9.0%
UNEMPLOYMENT AMONG SENIORS OVER 75 YEARS
7.7/ 100
METRIC RATING
221st/ 347
METRIC RANK
5.9%
UNEMPLOYMENT AMONG SENIORS OVER 75 YEARS
100.0/ 100
METRIC RATING
2nd/ 347
METRIC RANK
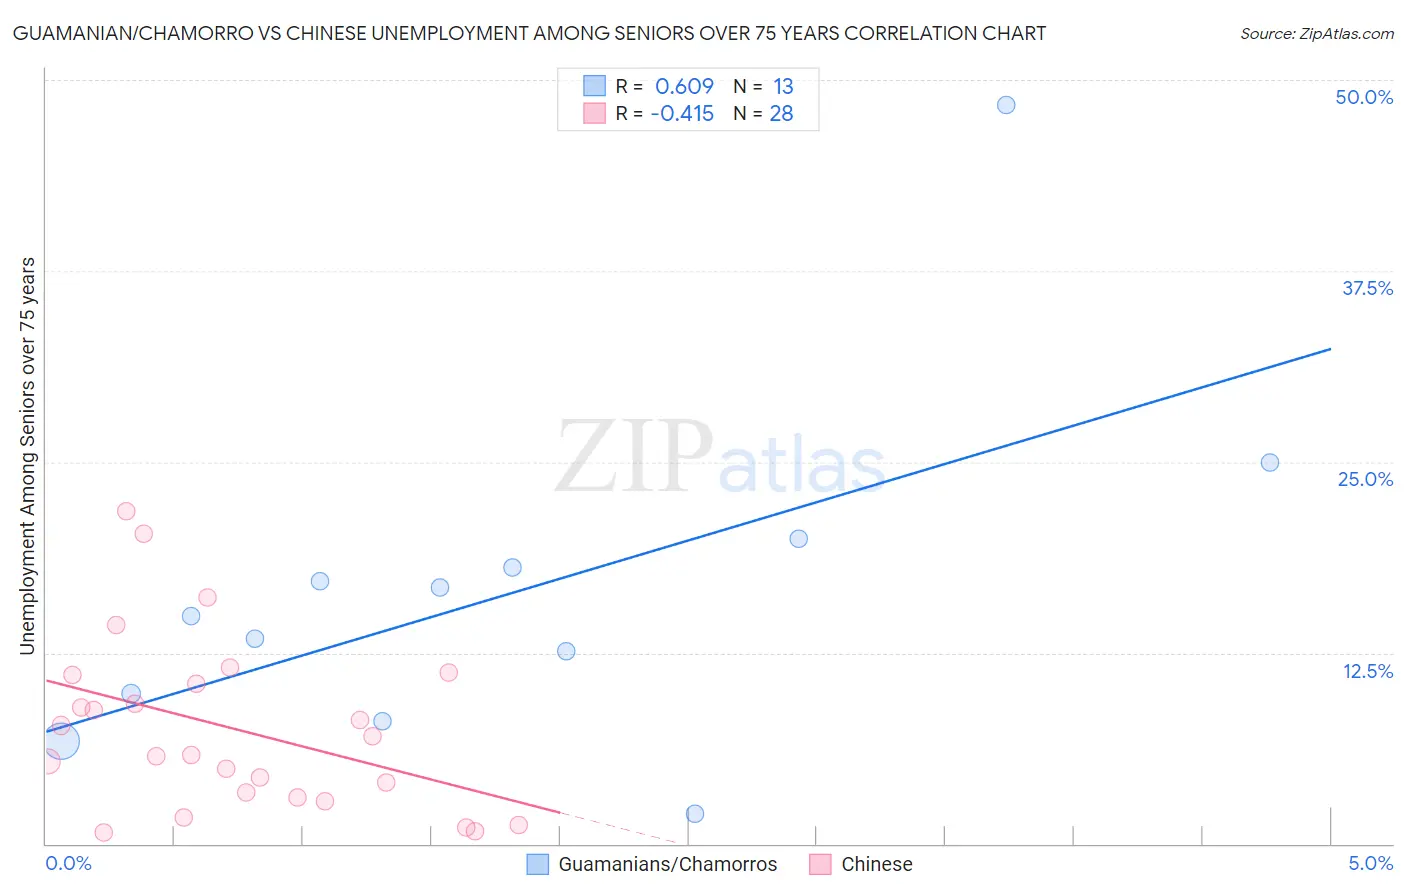
Guamanian/Chamorro vs Chinese Unemployment Among Seniors over 75 years Correlation Chart
The statistical analysis conducted on geographies consisting of 136,667,243 people shows a significant positive correlation between the proportion of Guamanians/Chamorros and unemployment rate among seniors over the age of 75 in the United States with a correlation coefficient (R) of 0.609 and weighted average of 9.0%. Similarly, the statistical analysis conducted on geographies consisting of 51,942,517 people shows a moderate negative correlation between the proportion of Chinese and unemployment rate among seniors over the age of 75 in the United States with a correlation coefficient (R) of -0.415 and weighted average of 5.9%, a difference of 52.9%.
Unemployment Among Seniors over 75 years Correlation Summary
| Measurement | Guamanian/Chamorro | Chinese |
| Minimum | 2.0% | 0.70% |
| Maximum | 48.4% | 21.8% |
| Range | 46.4% | 21.1% |
| Mean | 16.4% | 7.5% |
| Median | 14.9% | 6.4% |
| Interquartile 25% (IQ1) | 8.9% | 3.2% |
| Interquartile 75% (IQ3) | 19.0% | 10.8% |
| Interquartile Range (IQR) | 10.1% | 7.6% |
| Standard Deviation (Sample) | 11.4% | 5.6% |
| Standard Deviation (Population) | 10.9% | 5.5% |
Similar Demographics by Unemployment Among Seniors over 75 years
Demographics Similar to Guamanians/Chamorros by Unemployment Among Seniors over 75 years
In terms of unemployment among seniors over 75 years, the demographic groups most similar to Guamanians/Chamorros are Immigrants from Zimbabwe (9.0%, a difference of 0.020%), Peruvian (9.0%, a difference of 0.070%), Afghan (9.0%, a difference of 0.10%), Immigrants from Jordan (9.0%, a difference of 0.14%), and Costa Rican (9.1%, a difference of 0.27%).
| Demographics | Rating | Rank | Unemployment Among Seniors over 75 years |
| Immigrants | Brazil | 13.3 /100 | #214 | Poor 9.0% |
| Immigrants | Western Asia | 12.5 /100 | #215 | Poor 9.0% |
| Immigrants | Oceania | 11.8 /100 | #216 | Poor 9.0% |
| Lebanese | 11.1 /100 | #217 | Poor 9.0% |
| Immigrants | Africa | 9.7 /100 | #218 | Tragic 9.0% |
| Afghans | 8.3 /100 | #219 | Tragic 9.0% |
| Immigrants | Zimbabwe | 7.8 /100 | #220 | Tragic 9.0% |
| Guamanians/Chamorros | 7.7 /100 | #221 | Tragic 9.0% |
| Peruvians | 7.3 /100 | #222 | Tragic 9.0% |
| Immigrants | Jordan | 6.9 /100 | #223 | Tragic 9.0% |
| Costa Ricans | 6.3 /100 | #224 | Tragic 9.1% |
| Navajo | 6.1 /100 | #225 | Tragic 9.1% |
| Immigrants | Bangladesh | 5.9 /100 | #226 | Tragic 9.1% |
| Samoans | 5.7 /100 | #227 | Tragic 9.1% |
| Kenyans | 5.4 /100 | #228 | Tragic 9.1% |
Demographics Similar to Chinese by Unemployment Among Seniors over 75 years
In terms of unemployment among seniors over 75 years, the demographic groups most similar to Chinese are Crow (5.9%, a difference of 0.010%), Cheyenne (5.9%, a difference of 0.55%), Alsatian (6.1%, a difference of 3.5%), Hopi (6.3%, a difference of 6.1%), and Immigrants from Armenia (6.5%, a difference of 10.2%).
| Demographics | Rating | Rank | Unemployment Among Seniors over 75 years |
| Crow | 100.0 /100 | #1 | Exceptional 5.9% |
| Chinese | 100.0 /100 | #2 | Exceptional 5.9% |
| Cheyenne | 100.0 /100 | #3 | Exceptional 5.9% |
| Alsatians | 100.0 /100 | #4 | Exceptional 6.1% |
| Hopi | 100.0 /100 | #5 | Exceptional 6.3% |
| Immigrants | Armenia | 100.0 /100 | #6 | Exceptional 6.5% |
| Spanish American Indians | 100.0 /100 | #7 | Exceptional 6.5% |
| Taiwanese | 100.0 /100 | #8 | Exceptional 6.6% |
| Soviet Union | 100.0 /100 | #9 | Exceptional 6.6% |
| Yuman | 100.0 /100 | #10 | Exceptional 6.7% |
| Immigrants | Grenada | 100.0 /100 | #11 | Exceptional 6.7% |
| Comanche | 100.0 /100 | #12 | Exceptional 6.7% |
| Immigrants | Congo | 100.0 /100 | #13 | Exceptional 6.7% |
| Ute | 100.0 /100 | #14 | Exceptional 6.8% |
| Icelanders | 100.0 /100 | #15 | Exceptional 7.0% |