German Russian vs Sioux Disability Age Under 5
COMPARE
German Russian
Sioux
Disability Age Under 5
Disability Age Under 5 Comparison
German Russians
Sioux
1.6%
DISABILITY AGE UNDER 5
0.0/ 100
METRIC RATING
301st/ 347
METRIC RANK
1.8%
DISABILITY AGE UNDER 5
0.0/ 100
METRIC RATING
326th/ 347
METRIC RANK
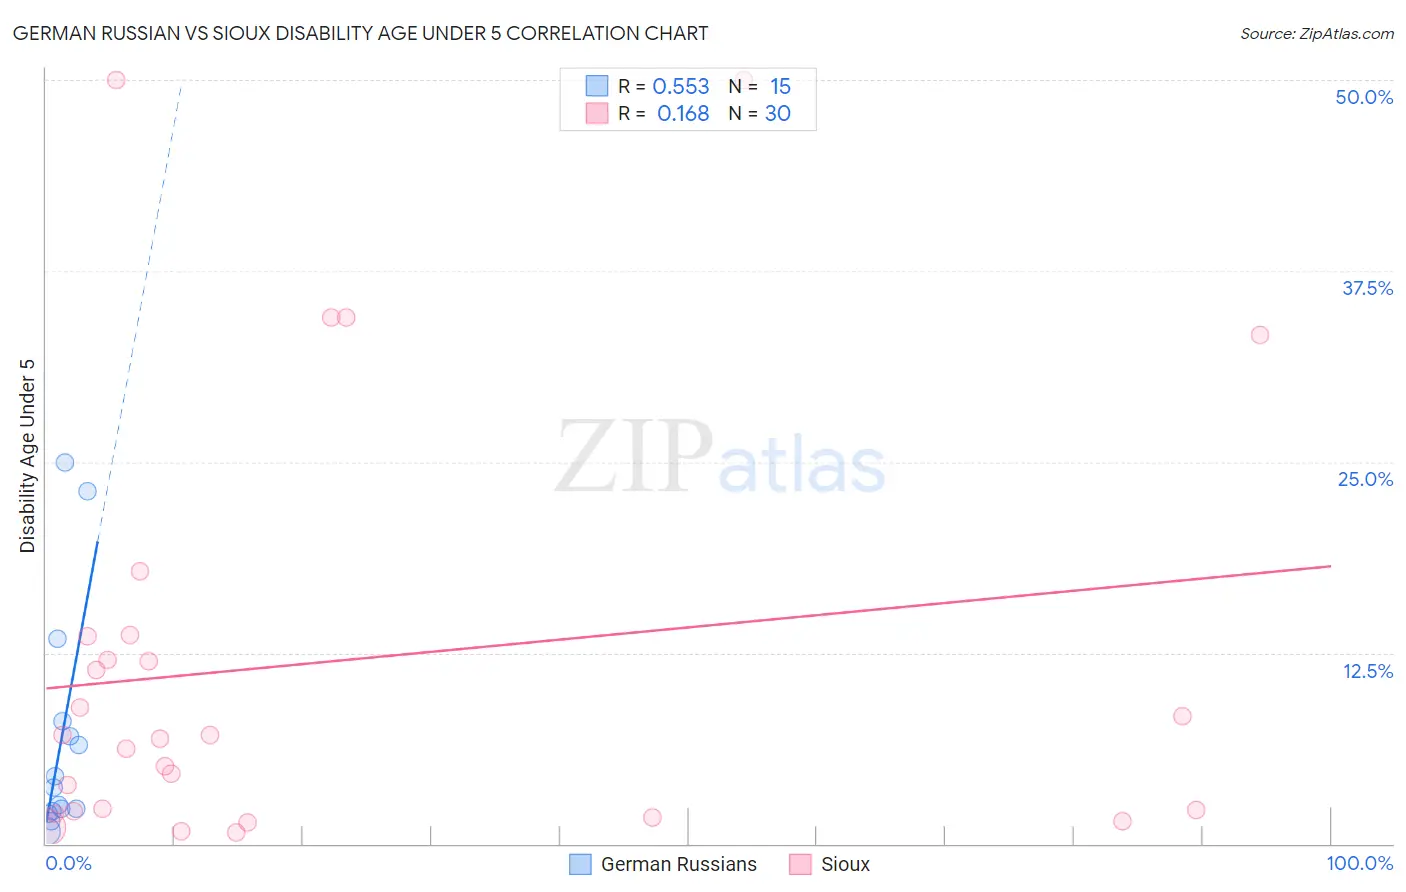
German Russian vs Sioux Disability Age Under 5 Correlation Chart
The statistical analysis conducted on geographies consisting of 78,222,474 people shows a substantial positive correlation between the proportion of German Russians and percentage of population with a disability under the age of 5 in the United States with a correlation coefficient (R) of 0.553 and weighted average of 1.6%. Similarly, the statistical analysis conducted on geographies consisting of 151,129,395 people shows a poor positive correlation between the proportion of Sioux and percentage of population with a disability under the age of 5 in the United States with a correlation coefficient (R) of 0.168 and weighted average of 1.8%, a difference of 11.8%.
Disability Age Under 5 Correlation Summary
| Measurement | German Russian | Sioux |
| Minimum | 0.81% | 0.72% |
| Maximum | 25.0% | 50.0% |
| Range | 24.2% | 49.3% |
| Mean | 7.0% | 11.9% |
| Median | 3.7% | 7.0% |
| Interquartile 25% (IQ1) | 2.1% | 2.1% |
| Interquartile 75% (IQ3) | 8.0% | 13.6% |
| Interquartile Range (IQR) | 5.8% | 11.5% |
| Standard Deviation (Sample) | 7.7% | 14.1% |
| Standard Deviation (Population) | 7.4% | 13.9% |
Similar Demographics by Disability Age Under 5
Demographics Similar to German Russians by Disability Age Under 5
In terms of disability age under 5, the demographic groups most similar to German Russians are Welsh (1.6%, a difference of 0.12%), Swiss (1.6%, a difference of 0.27%), Shoshone (1.6%, a difference of 0.44%), Portuguese (1.6%, a difference of 0.78%), and Seminole (1.6%, a difference of 0.91%).
| Demographics | Rating | Rank | Disability Age Under 5 |
| Swedes | 0.0 /100 | #294 | Tragic 1.6% |
| Finns | 0.0 /100 | #295 | Tragic 1.6% |
| Poles | 0.0 /100 | #296 | Tragic 1.6% |
| Immigrants | Nonimmigrants | 0.0 /100 | #297 | Tragic 1.6% |
| Cajuns | 0.0 /100 | #298 | Tragic 1.6% |
| Portuguese | 0.0 /100 | #299 | Tragic 1.6% |
| Shoshone | 0.0 /100 | #300 | Tragic 1.6% |
| German Russians | 0.0 /100 | #301 | Tragic 1.6% |
| Welsh | 0.0 /100 | #302 | Tragic 1.6% |
| Swiss | 0.0 /100 | #303 | Tragic 1.6% |
| Seminole | 0.0 /100 | #304 | Tragic 1.6% |
| Blackfeet | 0.0 /100 | #305 | Tragic 1.6% |
| Creek | 0.0 /100 | #306 | Tragic 1.6% |
| Scottish | 0.0 /100 | #307 | Tragic 1.6% |
| Navajo | 0.0 /100 | #308 | Tragic 1.6% |
Demographics Similar to Sioux by Disability Age Under 5
In terms of disability age under 5, the demographic groups most similar to Sioux are Osage (1.8%, a difference of 0.39%), Immigrants from Portugal (1.8%, a difference of 1.4%), American (1.9%, a difference of 2.1%), Houma (1.9%, a difference of 2.6%), and Cherokee (1.8%, a difference of 2.8%).
| Demographics | Rating | Rank | Disability Age Under 5 |
| Slovaks | 0.0 /100 | #319 | Tragic 1.7% |
| Scotch-Irish | 0.0 /100 | #320 | Tragic 1.7% |
| Ottawa | 0.0 /100 | #321 | Tragic 1.7% |
| Germans | 0.0 /100 | #322 | Tragic 1.7% |
| Chickasaw | 0.0 /100 | #323 | Tragic 1.7% |
| Cherokee | 0.0 /100 | #324 | Tragic 1.8% |
| Immigrants | Portugal | 0.0 /100 | #325 | Tragic 1.8% |
| Sioux | 0.0 /100 | #326 | Tragic 1.8% |
| Osage | 0.0 /100 | #327 | Tragic 1.8% |
| Americans | 0.0 /100 | #328 | Tragic 1.9% |
| Houma | 0.0 /100 | #329 | Tragic 1.9% |
| Choctaw | 0.0 /100 | #330 | Tragic 1.9% |
| French Canadians | 0.0 /100 | #331 | Tragic 1.9% |
| Chippewa | 0.0 /100 | #332 | Tragic 1.9% |
| Dutch West Indians | 0.0 /100 | #333 | Tragic 1.9% |