Immigrants vs Sioux Disability Age Under 5
COMPARE
Immigrants
Sioux
Disability Age Under 5
Disability Age Under 5 Comparison
Immigrants
Sioux
1.2%
DISABILITY AGE UNDER 5
88.0/ 100
METRIC RATING
129th/ 347
METRIC RANK
1.8%
DISABILITY AGE UNDER 5
0.0/ 100
METRIC RATING
326th/ 347
METRIC RANK
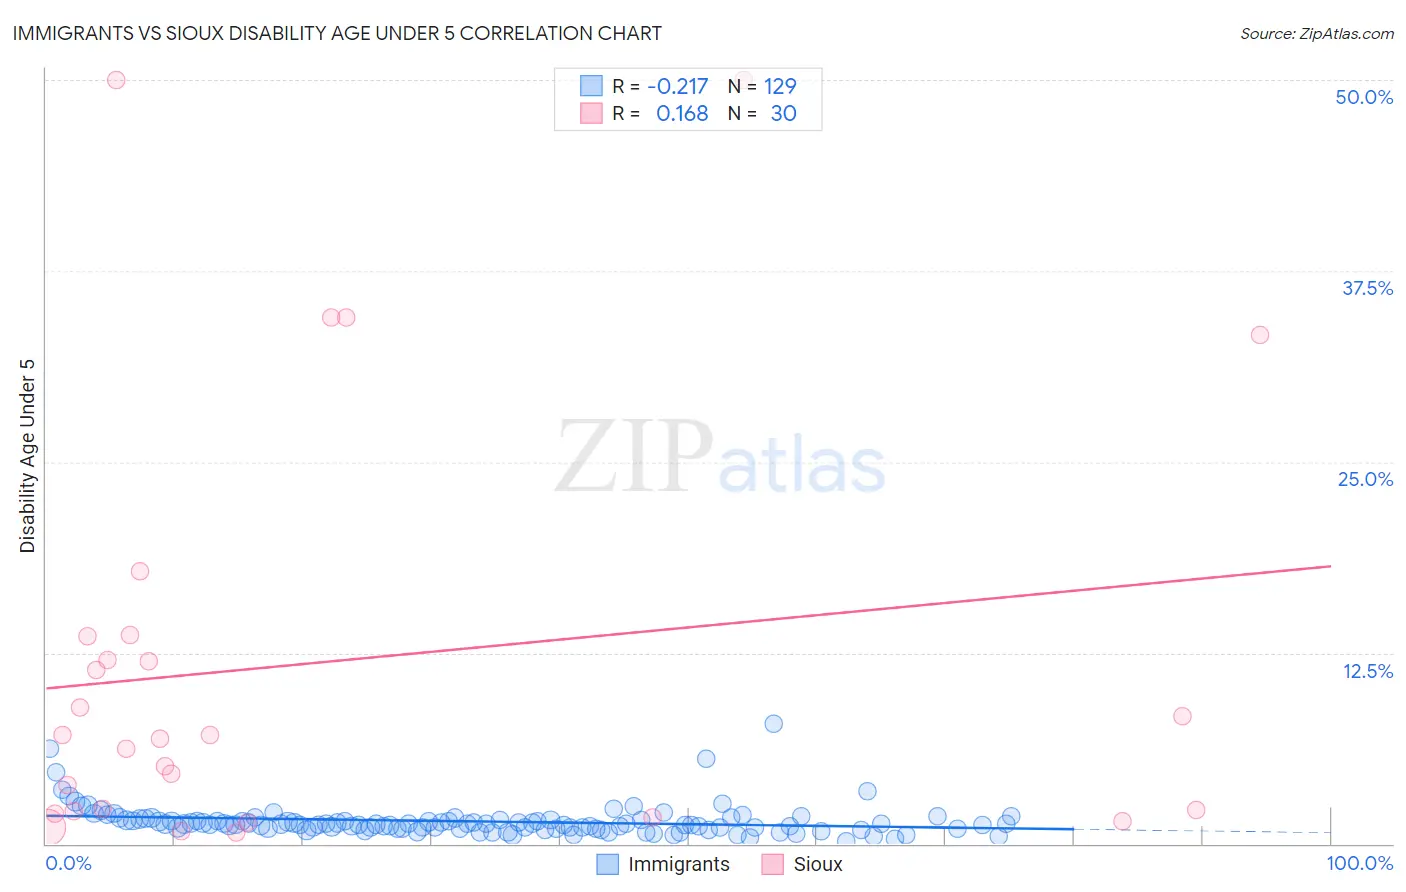
Immigrants vs Sioux Disability Age Under 5 Correlation Chart
The statistical analysis conducted on geographies consisting of 262,190,696 people shows a weak negative correlation between the proportion of Immigrants and percentage of population with a disability under the age of 5 in the United States with a correlation coefficient (R) of -0.217 and weighted average of 1.2%. Similarly, the statistical analysis conducted on geographies consisting of 151,129,395 people shows a poor positive correlation between the proportion of Sioux and percentage of population with a disability under the age of 5 in the United States with a correlation coefficient (R) of 0.168 and weighted average of 1.8%, a difference of 53.7%.
Disability Age Under 5 Correlation Summary
| Measurement | Immigrants | Sioux |
| Minimum | 0.14% | 0.72% |
| Maximum | 7.9% | 50.0% |
| Range | 7.8% | 49.3% |
| Mean | 1.5% | 11.9% |
| Median | 1.3% | 7.0% |
| Interquartile 25% (IQ1) | 1.0% | 2.1% |
| Interquartile 75% (IQ3) | 1.5% | 13.6% |
| Interquartile Range (IQR) | 0.54% | 11.5% |
| Standard Deviation (Sample) | 1.0% | 14.1% |
| Standard Deviation (Population) | 1.0% | 13.9% |
Similar Demographics by Disability Age Under 5
Demographics Similar to Immigrants by Disability Age Under 5
In terms of disability age under 5, the demographic groups most similar to Immigrants are Korean (1.2%, a difference of 0.080%), Immigrants from Romania (1.2%, a difference of 0.090%), Immigrants from France (1.2%, a difference of 0.090%), Immigrants from Serbia (1.2%, a difference of 0.090%), and Immigrants from Eastern Europe (1.2%, a difference of 0.16%).
| Demographics | Rating | Rank | Disability Age Under 5 |
| Aleuts | 90.7 /100 | #122 | Exceptional 1.2% |
| Zimbabweans | 90.6 /100 | #123 | Exceptional 1.2% |
| Immigrants | Cambodia | 90.5 /100 | #124 | Exceptional 1.2% |
| Japanese | 90.3 /100 | #125 | Exceptional 1.2% |
| Central Americans | 89.7 /100 | #126 | Excellent 1.2% |
| Immigrants | Romania | 88.4 /100 | #127 | Excellent 1.2% |
| Immigrants | France | 88.4 /100 | #128 | Excellent 1.2% |
| Immigrants | Immigrants | 88.0 /100 | #129 | Excellent 1.2% |
| Koreans | 87.7 /100 | #130 | Excellent 1.2% |
| Immigrants | Serbia | 87.6 /100 | #131 | Excellent 1.2% |
| Immigrants | Eastern Europe | 87.3 /100 | #132 | Excellent 1.2% |
| Immigrants | Spain | 86.5 /100 | #133 | Excellent 1.2% |
| Argentineans | 85.7 /100 | #134 | Excellent 1.2% |
| Fijians | 84.7 /100 | #135 | Excellent 1.2% |
| Moroccans | 83.6 /100 | #136 | Excellent 1.2% |
Demographics Similar to Sioux by Disability Age Under 5
In terms of disability age under 5, the demographic groups most similar to Sioux are Osage (1.8%, a difference of 0.39%), Immigrants from Portugal (1.8%, a difference of 1.4%), American (1.9%, a difference of 2.1%), Houma (1.9%, a difference of 2.6%), and Cherokee (1.8%, a difference of 2.8%).
| Demographics | Rating | Rank | Disability Age Under 5 |
| Slovaks | 0.0 /100 | #319 | Tragic 1.7% |
| Scotch-Irish | 0.0 /100 | #320 | Tragic 1.7% |
| Ottawa | 0.0 /100 | #321 | Tragic 1.7% |
| Germans | 0.0 /100 | #322 | Tragic 1.7% |
| Chickasaw | 0.0 /100 | #323 | Tragic 1.7% |
| Cherokee | 0.0 /100 | #324 | Tragic 1.8% |
| Immigrants | Portugal | 0.0 /100 | #325 | Tragic 1.8% |
| Sioux | 0.0 /100 | #326 | Tragic 1.8% |
| Osage | 0.0 /100 | #327 | Tragic 1.8% |
| Americans | 0.0 /100 | #328 | Tragic 1.9% |
| Houma | 0.0 /100 | #329 | Tragic 1.9% |
| Choctaw | 0.0 /100 | #330 | Tragic 1.9% |
| French Canadians | 0.0 /100 | #331 | Tragic 1.9% |
| Chippewa | 0.0 /100 | #332 | Tragic 1.9% |
| Dutch West Indians | 0.0 /100 | #333 | Tragic 1.9% |