Carpatho Rusyn vs Sioux Disability Age Under 5
COMPARE
Carpatho Rusyn
Sioux
Disability Age Under 5
Disability Age Under 5 Comparison
Carpatho Rusyns
Sioux
1.4%
DISABILITY AGE UNDER 5
0.1/ 100
METRIC RATING
265th/ 347
METRIC RANK
1.8%
DISABILITY AGE UNDER 5
0.0/ 100
METRIC RATING
326th/ 347
METRIC RANK
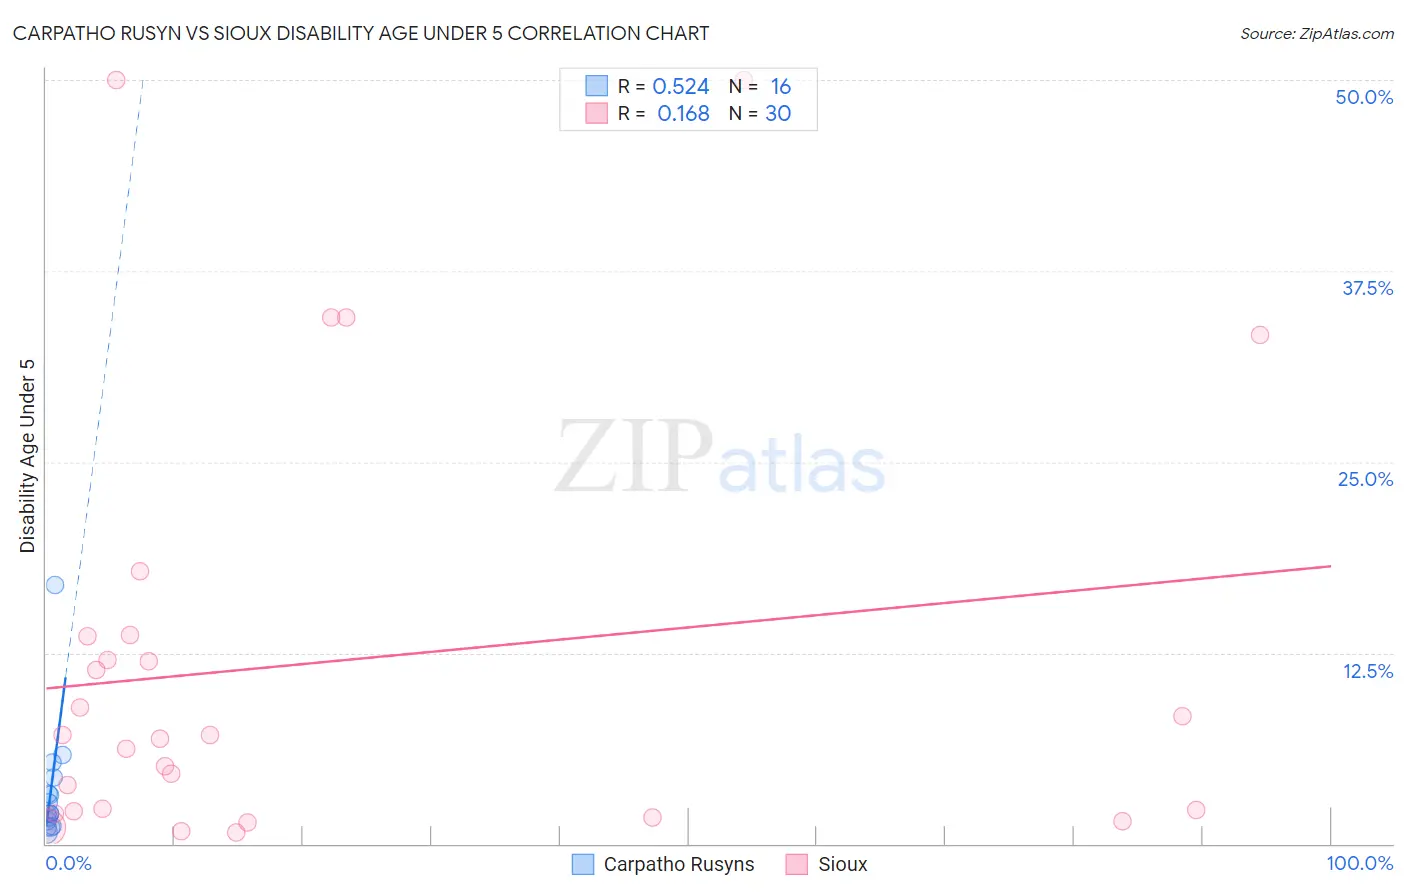
Carpatho Rusyn vs Sioux Disability Age Under 5 Correlation Chart
The statistical analysis conducted on geographies consisting of 46,602,246 people shows a substantial positive correlation between the proportion of Carpatho Rusyns and percentage of population with a disability under the age of 5 in the United States with a correlation coefficient (R) of 0.524 and weighted average of 1.4%. Similarly, the statistical analysis conducted on geographies consisting of 151,129,395 people shows a poor positive correlation between the proportion of Sioux and percentage of population with a disability under the age of 5 in the United States with a correlation coefficient (R) of 0.168 and weighted average of 1.8%, a difference of 27.9%.
Disability Age Under 5 Correlation Summary
| Measurement | Carpatho Rusyn | Sioux |
| Minimum | 0.78% | 0.72% |
| Maximum | 16.9% | 50.0% |
| Range | 16.2% | 49.3% |
| Mean | 3.4% | 11.9% |
| Median | 2.0% | 7.0% |
| Interquartile 25% (IQ1) | 1.3% | 2.1% |
| Interquartile 75% (IQ3) | 3.8% | 13.6% |
| Interquartile Range (IQR) | 2.5% | 11.5% |
| Standard Deviation (Sample) | 3.9% | 14.1% |
| Standard Deviation (Population) | 3.8% | 13.9% |
Similar Demographics by Disability Age Under 5
Demographics Similar to Carpatho Rusyns by Disability Age Under 5
In terms of disability age under 5, the demographic groups most similar to Carpatho Rusyns are Immigrants from Germany (1.4%, a difference of 0.030%), Yugoslavian (1.4%, a difference of 0.040%), Spanish (1.4%, a difference of 0.19%), Immigrants from Dominica (1.4%, a difference of 0.25%), and Immigrants from Netherlands (1.4%, a difference of 0.41%).
| Demographics | Rating | Rank | Disability Age Under 5 |
| Costa Ricans | 0.3 /100 | #258 | Tragic 1.4% |
| Immigrants | Southern Europe | 0.3 /100 | #259 | Tragic 1.4% |
| Slavs | 0.3 /100 | #260 | Tragic 1.4% |
| Immigrants | Netherlands | 0.2 /100 | #261 | Tragic 1.4% |
| Immigrants | Dominica | 0.2 /100 | #262 | Tragic 1.4% |
| Spanish | 0.2 /100 | #263 | Tragic 1.4% |
| Yugoslavians | 0.1 /100 | #264 | Tragic 1.4% |
| Carpatho Rusyns | 0.1 /100 | #265 | Tragic 1.4% |
| Immigrants | Germany | 0.1 /100 | #266 | Tragic 1.4% |
| Cree | 0.1 /100 | #267 | Tragic 1.4% |
| Belgians | 0.1 /100 | #268 | Tragic 1.4% |
| Austrians | 0.1 /100 | #269 | Tragic 1.4% |
| Immigrants | North America | 0.1 /100 | #270 | Tragic 1.4% |
| Immigrants | Canada | 0.1 /100 | #271 | Tragic 1.4% |
| Blacks/African Americans | 0.1 /100 | #272 | Tragic 1.4% |
Demographics Similar to Sioux by Disability Age Under 5
In terms of disability age under 5, the demographic groups most similar to Sioux are Osage (1.8%, a difference of 0.39%), Immigrants from Portugal (1.8%, a difference of 1.4%), American (1.9%, a difference of 2.1%), Houma (1.9%, a difference of 2.6%), and Cherokee (1.8%, a difference of 2.8%).
| Demographics | Rating | Rank | Disability Age Under 5 |
| Slovaks | 0.0 /100 | #319 | Tragic 1.7% |
| Scotch-Irish | 0.0 /100 | #320 | Tragic 1.7% |
| Ottawa | 0.0 /100 | #321 | Tragic 1.7% |
| Germans | 0.0 /100 | #322 | Tragic 1.7% |
| Chickasaw | 0.0 /100 | #323 | Tragic 1.7% |
| Cherokee | 0.0 /100 | #324 | Tragic 1.8% |
| Immigrants | Portugal | 0.0 /100 | #325 | Tragic 1.8% |
| Sioux | 0.0 /100 | #326 | Tragic 1.8% |
| Osage | 0.0 /100 | #327 | Tragic 1.8% |
| Americans | 0.0 /100 | #328 | Tragic 1.9% |
| Houma | 0.0 /100 | #329 | Tragic 1.9% |
| Choctaw | 0.0 /100 | #330 | Tragic 1.9% |
| French Canadians | 0.0 /100 | #331 | Tragic 1.9% |
| Chippewa | 0.0 /100 | #332 | Tragic 1.9% |
| Dutch West Indians | 0.0 /100 | #333 | Tragic 1.9% |