German Russian vs Sioux Unemployment Among Women with Children Under 6 years
COMPARE
German Russian
Sioux
Unemployment Among Women with Children Under 6 years
Unemployment Among Women with Children Under 6 years Comparison
German Russians
Sioux
8.2%
UNEMPLOYMENT AMONG WOMEN WITH CHILDREN UNDER 6 YEARS
1.2/ 100
METRIC RATING
247th/ 347
METRIC RANK
11.5%
UNEMPLOYMENT AMONG WOMEN WITH CHILDREN UNDER 6 YEARS
0.0/ 100
METRIC RATING
332nd/ 347
METRIC RANK
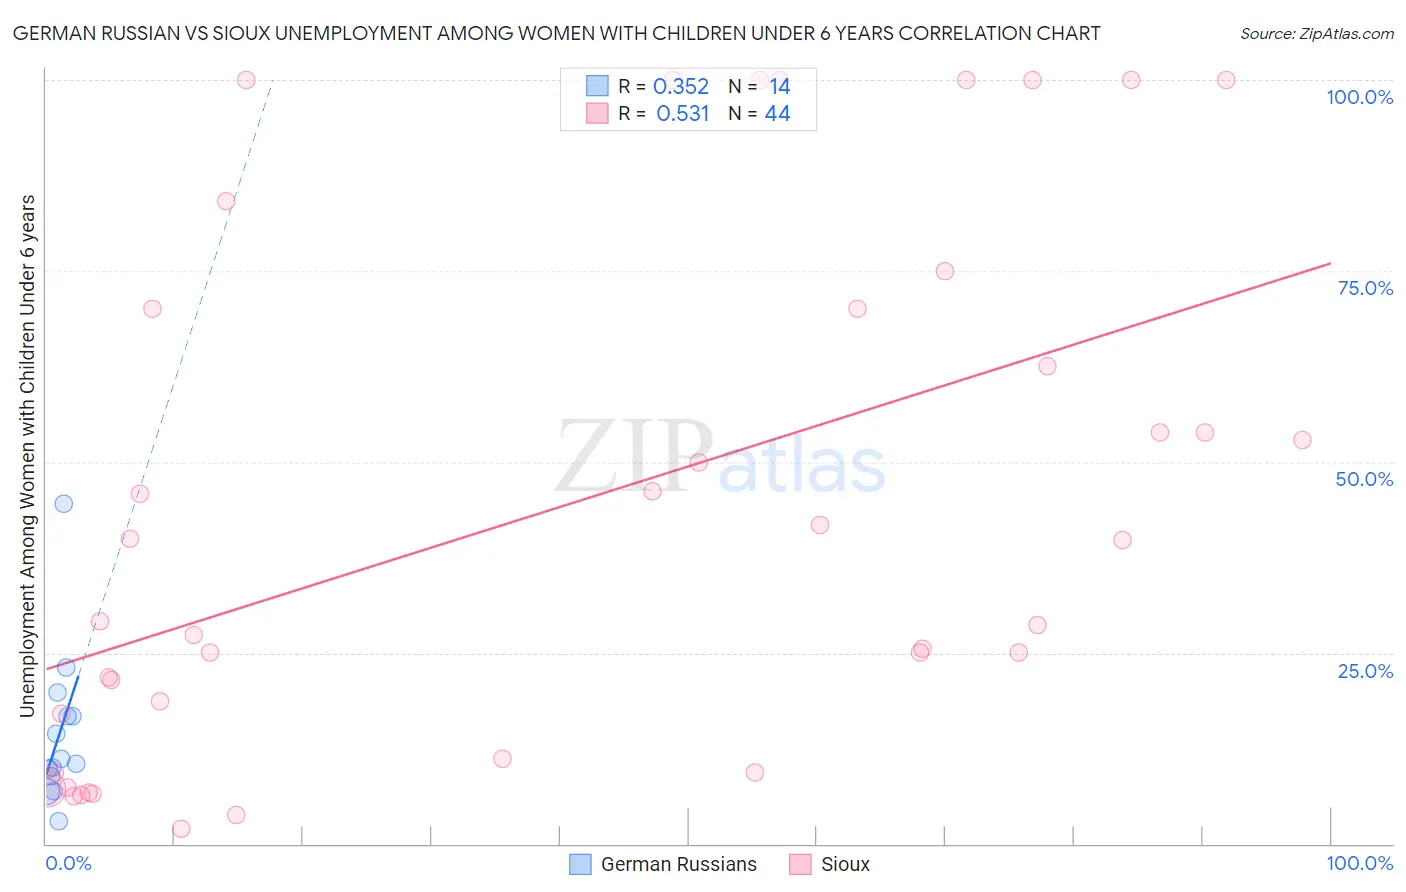
German Russian vs Sioux Unemployment Among Women with Children Under 6 years Correlation Chart
The statistical analysis conducted on geographies consisting of 86,977,720 people shows a mild positive correlation between the proportion of German Russians and unemployment rate among women with children under the age of 6 in the United States with a correlation coefficient (R) of 0.352 and weighted average of 8.2%. Similarly, the statistical analysis conducted on geographies consisting of 190,203,570 people shows a substantial positive correlation between the proportion of Sioux and unemployment rate among women with children under the age of 6 in the United States with a correlation coefficient (R) of 0.531 and weighted average of 11.5%, a difference of 39.6%.
Unemployment Among Women with Children Under 6 years Correlation Summary
| Measurement | German Russian | Sioux |
| Minimum | 2.9% | 2.0% |
| Maximum | 44.5% | 100.0% |
| Range | 41.5% | 98.0% |
| Mean | 14.4% | 43.8% |
| Median | 10.8% | 34.5% |
| Interquartile 25% (IQ1) | 8.9% | 14.1% |
| Interquartile 75% (IQ3) | 16.7% | 70.0% |
| Interquartile Range (IQR) | 7.8% | 55.9% |
| Standard Deviation (Sample) | 10.2% | 33.9% |
| Standard Deviation (Population) | 9.9% | 33.5% |
Similar Demographics by Unemployment Among Women with Children Under 6 years
Demographics Similar to German Russians by Unemployment Among Women with Children Under 6 years
In terms of unemployment among women with children under 6 years, the demographic groups most similar to German Russians are Immigrants from Western Africa (8.2%, a difference of 0.040%), Immigrants from Sierra Leone (8.2%, a difference of 0.13%), Nigerian (8.2%, a difference of 0.14%), Central American (8.2%, a difference of 0.28%), and Guyanese (8.2%, a difference of 0.31%).
| Demographics | Rating | Rank | Unemployment Among Women with Children Under 6 years |
| Immigrants | El Salvador | 2.6 /100 | #240 | Tragic 8.1% |
| Liberians | 2.6 /100 | #241 | Tragic 8.1% |
| Dutch | 2.5 /100 | #242 | Tragic 8.1% |
| Hawaiians | 1.8 /100 | #243 | Tragic 8.2% |
| French | 1.7 /100 | #244 | Tragic 8.2% |
| Native Hawaiians | 1.7 /100 | #245 | Tragic 8.2% |
| Central Americans | 1.4 /100 | #246 | Tragic 8.2% |
| German Russians | 1.2 /100 | #247 | Tragic 8.2% |
| Immigrants | Western Africa | 1.1 /100 | #248 | Tragic 8.2% |
| Immigrants | Sierra Leone | 1.1 /100 | #249 | Tragic 8.2% |
| Nigerians | 1.1 /100 | #250 | Tragic 8.2% |
| Guyanese | 1.0 /100 | #251 | Tragic 8.2% |
| Ghanaians | 1.0 /100 | #252 | Tragic 8.2% |
| Immigrants | Guyana | 0.8 /100 | #253 | Tragic 8.2% |
| Immigrants | Caribbean | 0.7 /100 | #254 | Tragic 8.3% |
Demographics Similar to Sioux by Unemployment Among Women with Children Under 6 years
In terms of unemployment among women with children under 6 years, the demographic groups most similar to Sioux are Native/Alaskan (11.5%, a difference of 0.56%), Colville (11.2%, a difference of 2.7%), Pennsylvania German (10.8%, a difference of 6.4%), Apache (12.3%, a difference of 7.5%), and Puerto Rican (12.5%, a difference of 9.5%).
| Demographics | Rating | Rank | Unemployment Among Women with Children Under 6 years |
| Choctaw | 0.0 /100 | #325 | Tragic 9.8% |
| Delaware | 0.0 /100 | #326 | Tragic 9.8% |
| Ottawa | 0.0 /100 | #327 | Tragic 9.9% |
| Tohono O'odham | 0.0 /100 | #328 | Tragic 10.2% |
| Blacks/African Americans | 0.0 /100 | #329 | Tragic 10.3% |
| Pennsylvania Germans | 0.0 /100 | #330 | Tragic 10.8% |
| Colville | 0.0 /100 | #331 | Tragic 11.2% |
| Sioux | 0.0 /100 | #332 | Tragic 11.5% |
| Natives/Alaskans | 0.0 /100 | #333 | Tragic 11.5% |
| Apache | 0.0 /100 | #334 | Tragic 12.3% |
| Puerto Ricans | 0.0 /100 | #335 | Tragic 12.5% |
| Shoshone | 0.0 /100 | #336 | Tragic 13.2% |
| Chippewa | 0.0 /100 | #337 | Tragic 13.3% |
| Pima | 0.0 /100 | #338 | Tragic 13.4% |
| Navajo | 0.0 /100 | #339 | Tragic 13.5% |