Icelander vs Sioux Disability Age Under 5
COMPARE
Icelander
Sioux
Disability Age Under 5
Disability Age Under 5 Comparison
Icelanders
Sioux
1.2%
DISABILITY AGE UNDER 5
76.3/ 100
METRIC RATING
147th/ 347
METRIC RANK
1.8%
DISABILITY AGE UNDER 5
0.0/ 100
METRIC RATING
326th/ 347
METRIC RANK
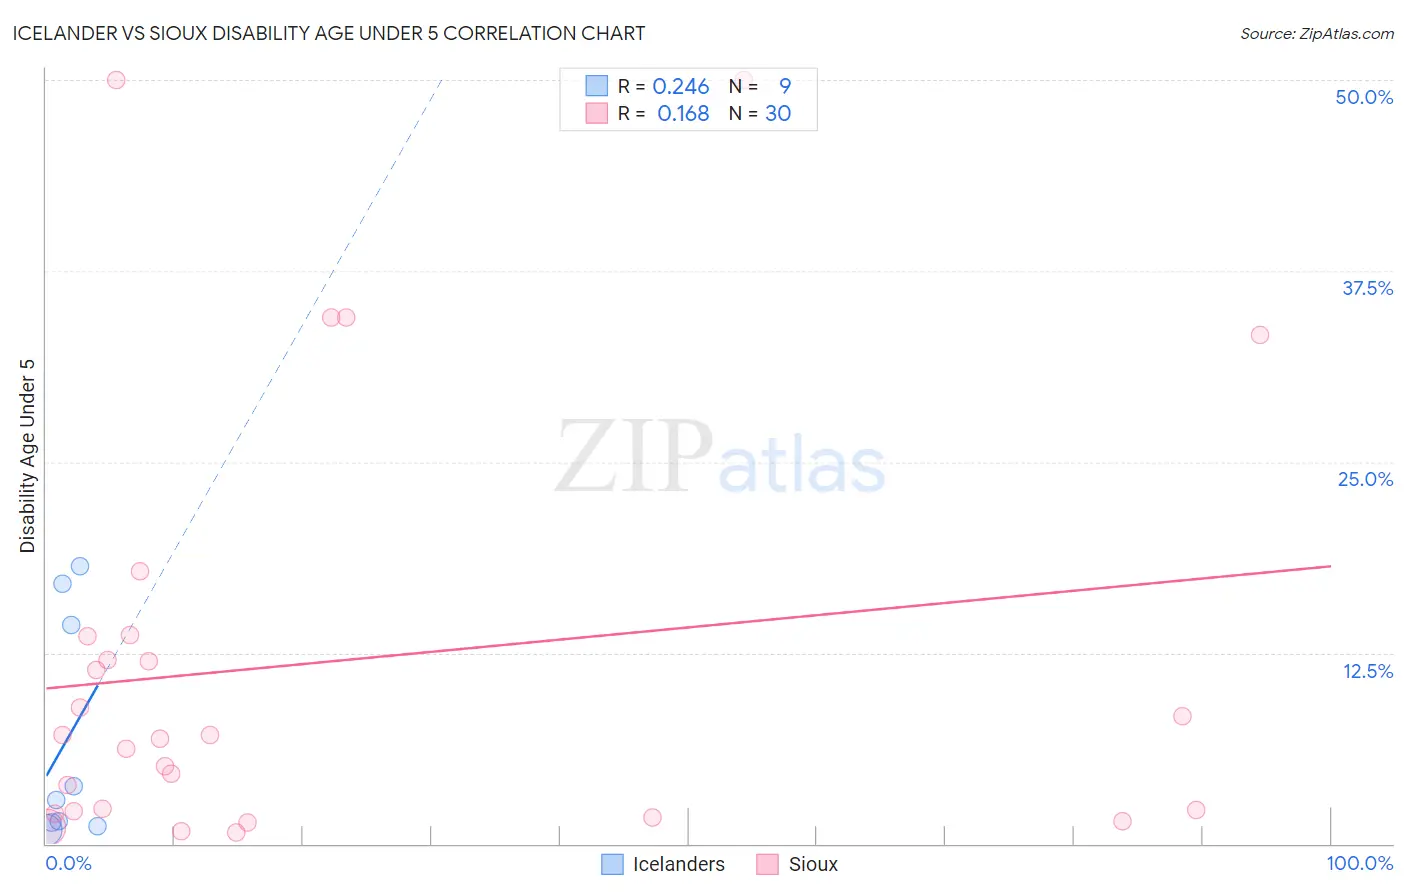
Icelander vs Sioux Disability Age Under 5 Correlation Chart
The statistical analysis conducted on geographies consisting of 109,787,781 people shows a weak positive correlation between the proportion of Icelanders and percentage of population with a disability under the age of 5 in the United States with a correlation coefficient (R) of 0.246 and weighted average of 1.2%. Similarly, the statistical analysis conducted on geographies consisting of 151,129,395 people shows a poor positive correlation between the proportion of Sioux and percentage of population with a disability under the age of 5 in the United States with a correlation coefficient (R) of 0.168 and weighted average of 1.8%, a difference of 50.8%.
Disability Age Under 5 Correlation Summary
| Measurement | Icelander | Sioux |
| Minimum | 0.91% | 0.72% |
| Maximum | 18.2% | 50.0% |
| Range | 17.3% | 49.3% |
| Mean | 6.8% | 11.9% |
| Median | 2.8% | 7.0% |
| Interquartile 25% (IQ1) | 1.3% | 2.1% |
| Interquartile 75% (IQ3) | 15.6% | 13.6% |
| Interquartile Range (IQR) | 14.4% | 11.5% |
| Standard Deviation (Sample) | 7.4% | 14.1% |
| Standard Deviation (Population) | 7.0% | 13.9% |
Similar Demographics by Disability Age Under 5
Demographics Similar to Icelanders by Disability Age Under 5
In terms of disability age under 5, the demographic groups most similar to Icelanders are Ghanaian (1.2%, a difference of 0.010%), Kenyan (1.2%, a difference of 0.060%), South American (1.2%, a difference of 0.10%), Samoan (1.2%, a difference of 0.18%), and Yaqui (1.2%, a difference of 0.20%).
| Demographics | Rating | Rank | Disability Age Under 5 |
| Somalis | 80.8 /100 | #140 | Excellent 1.2% |
| Immigrants | Honduras | 80.4 /100 | #141 | Excellent 1.2% |
| Immigrants | Colombia | 79.3 /100 | #142 | Good 1.2% |
| Alsatians | 79.3 /100 | #143 | Good 1.2% |
| Immigrants | Middle Africa | 79.3 /100 | #144 | Good 1.2% |
| Immigrants | Zimbabwe | 77.9 /100 | #145 | Good 1.2% |
| Samoans | 77.7 /100 | #146 | Good 1.2% |
| Icelanders | 76.3 /100 | #147 | Good 1.2% |
| Ghanaians | 76.3 /100 | #148 | Good 1.2% |
| Kenyans | 75.9 /100 | #149 | Good 1.2% |
| South Americans | 75.6 /100 | #150 | Good 1.2% |
| Yaqui | 74.8 /100 | #151 | Good 1.2% |
| Hondurans | 72.5 /100 | #152 | Good 1.2% |
| Immigrants | Thailand | 69.4 /100 | #153 | Good 1.2% |
| Uruguayans | 68.8 /100 | #154 | Good 1.2% |
Demographics Similar to Sioux by Disability Age Under 5
In terms of disability age under 5, the demographic groups most similar to Sioux are Osage (1.8%, a difference of 0.39%), Immigrants from Portugal (1.8%, a difference of 1.4%), American (1.9%, a difference of 2.1%), Houma (1.9%, a difference of 2.6%), and Cherokee (1.8%, a difference of 2.8%).
| Demographics | Rating | Rank | Disability Age Under 5 |
| Slovaks | 0.0 /100 | #319 | Tragic 1.7% |
| Scotch-Irish | 0.0 /100 | #320 | Tragic 1.7% |
| Ottawa | 0.0 /100 | #321 | Tragic 1.7% |
| Germans | 0.0 /100 | #322 | Tragic 1.7% |
| Chickasaw | 0.0 /100 | #323 | Tragic 1.7% |
| Cherokee | 0.0 /100 | #324 | Tragic 1.8% |
| Immigrants | Portugal | 0.0 /100 | #325 | Tragic 1.8% |
| Sioux | 0.0 /100 | #326 | Tragic 1.8% |
| Osage | 0.0 /100 | #327 | Tragic 1.8% |
| Americans | 0.0 /100 | #328 | Tragic 1.9% |
| Houma | 0.0 /100 | #329 | Tragic 1.9% |
| Choctaw | 0.0 /100 | #330 | Tragic 1.9% |
| French Canadians | 0.0 /100 | #331 | Tragic 1.9% |
| Chippewa | 0.0 /100 | #332 | Tragic 1.9% |
| Dutch West Indians | 0.0 /100 | #333 | Tragic 1.9% |