German Russian vs Immigrants from Barbados Disability Age Under 5
COMPARE
German Russian
Immigrants from Barbados
Disability Age Under 5
Disability Age Under 5 Comparison
German Russians
Immigrants from Barbados
1.6%
DISABILITY AGE UNDER 5
0.0/ 100
METRIC RATING
301st/ 347
METRIC RANK
0.97%
DISABILITY AGE UNDER 5
100.0/ 100
METRIC RATING
18th/ 347
METRIC RANK
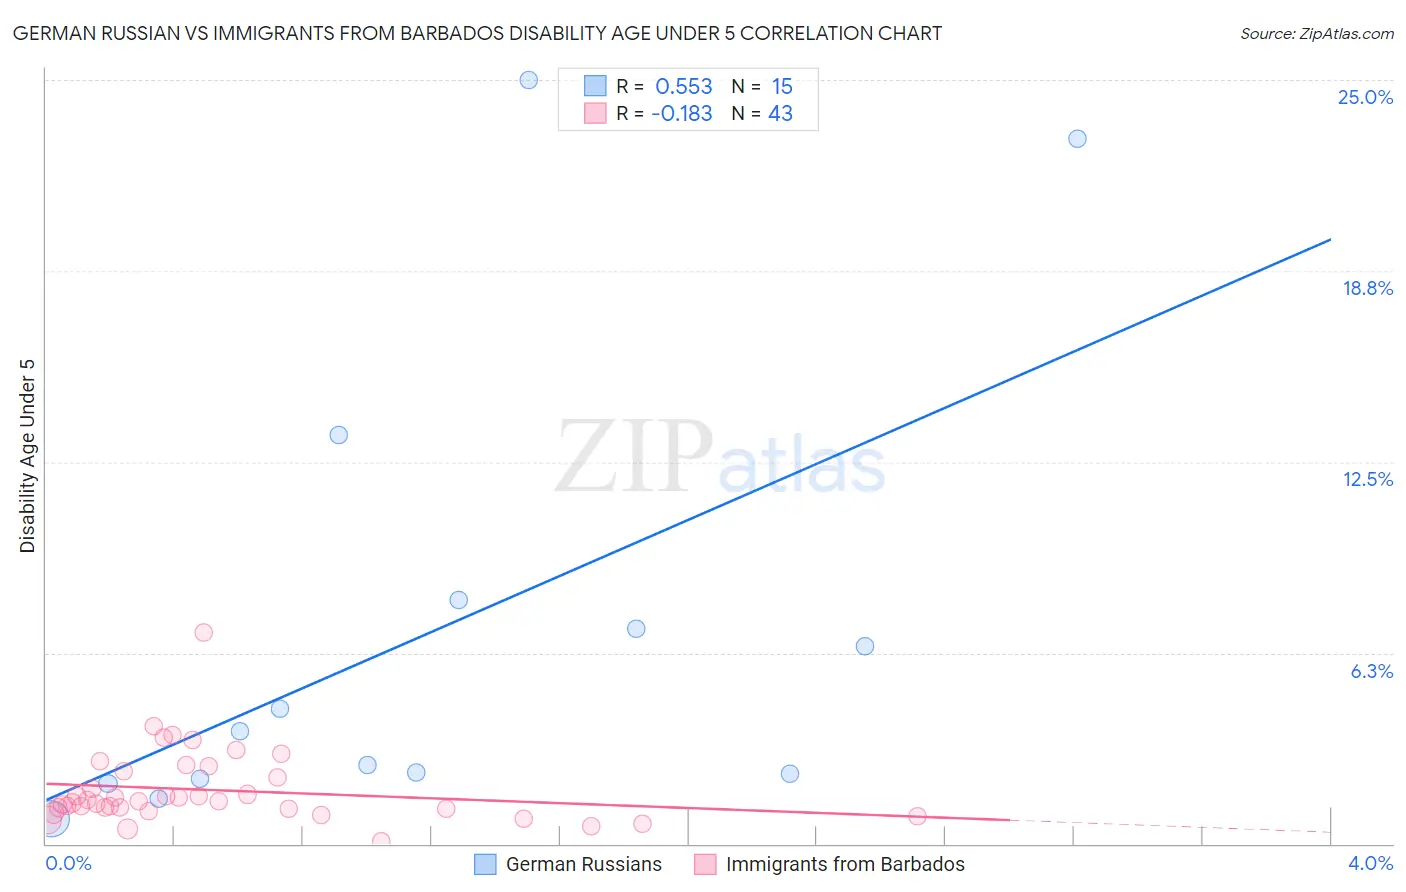
German Russian vs Immigrants from Barbados Disability Age Under 5 Correlation Chart
The statistical analysis conducted on geographies consisting of 78,222,474 people shows a substantial positive correlation between the proportion of German Russians and percentage of population with a disability under the age of 5 in the United States with a correlation coefficient (R) of 0.553 and weighted average of 1.6%. Similarly, the statistical analysis conducted on geographies consisting of 80,516,356 people shows a poor negative correlation between the proportion of Immigrants from Barbados and percentage of population with a disability under the age of 5 in the United States with a correlation coefficient (R) of -0.183 and weighted average of 0.97%, a difference of 68.1%.
Disability Age Under 5 Correlation Summary
| Measurement | German Russian | Immigrants from Barbados |
| Minimum | 0.81% | 0.086% |
| Maximum | 25.0% | 6.9% |
| Range | 24.2% | 6.8% |
| Mean | 7.0% | 1.8% |
| Median | 3.7% | 1.4% |
| Interquartile 25% (IQ1) | 2.1% | 1.1% |
| Interquartile 75% (IQ3) | 8.0% | 2.4% |
| Interquartile Range (IQR) | 5.8% | 1.2% |
| Standard Deviation (Sample) | 7.7% | 1.2% |
| Standard Deviation (Population) | 7.4% | 1.2% |
Similar Demographics by Disability Age Under 5
Demographics Similar to German Russians by Disability Age Under 5
In terms of disability age under 5, the demographic groups most similar to German Russians are Welsh (1.6%, a difference of 0.12%), Swiss (1.6%, a difference of 0.27%), Shoshone (1.6%, a difference of 0.44%), Portuguese (1.6%, a difference of 0.78%), and Seminole (1.6%, a difference of 0.91%).
| Demographics | Rating | Rank | Disability Age Under 5 |
| Swedes | 0.0 /100 | #294 | Tragic 1.6% |
| Finns | 0.0 /100 | #295 | Tragic 1.6% |
| Poles | 0.0 /100 | #296 | Tragic 1.6% |
| Immigrants | Nonimmigrants | 0.0 /100 | #297 | Tragic 1.6% |
| Cajuns | 0.0 /100 | #298 | Tragic 1.6% |
| Portuguese | 0.0 /100 | #299 | Tragic 1.6% |
| Shoshone | 0.0 /100 | #300 | Tragic 1.6% |
| German Russians | 0.0 /100 | #301 | Tragic 1.6% |
| Welsh | 0.0 /100 | #302 | Tragic 1.6% |
| Swiss | 0.0 /100 | #303 | Tragic 1.6% |
| Seminole | 0.0 /100 | #304 | Tragic 1.6% |
| Blackfeet | 0.0 /100 | #305 | Tragic 1.6% |
| Creek | 0.0 /100 | #306 | Tragic 1.6% |
| Scottish | 0.0 /100 | #307 | Tragic 1.6% |
| Navajo | 0.0 /100 | #308 | Tragic 1.6% |
Demographics Similar to Immigrants from Barbados by Disability Age Under 5
In terms of disability age under 5, the demographic groups most similar to Immigrants from Barbados are Puget Sound Salish (0.97%, a difference of 0.37%), Nepalese (0.97%, a difference of 0.47%), Immigrants from China (0.96%, a difference of 0.58%), Immigrants from Israel (0.96%, a difference of 1.0%), and Immigrants from Hong Kong (0.95%, a difference of 2.3%).
| Demographics | Rating | Rank | Disability Age Under 5 |
| Afghans | 100.0 /100 | #11 | Exceptional 0.94% |
| Immigrants | Grenada | 100.0 /100 | #12 | Exceptional 0.94% |
| Soviet Union | 100.0 /100 | #13 | Exceptional 0.95% |
| Yuman | 100.0 /100 | #14 | Exceptional 0.95% |
| Immigrants | Hong Kong | 100.0 /100 | #15 | Exceptional 0.95% |
| Immigrants | Israel | 100.0 /100 | #16 | Exceptional 0.96% |
| Immigrants | China | 100.0 /100 | #17 | Exceptional 0.96% |
| Immigrants | Barbados | 100.0 /100 | #18 | Exceptional 0.97% |
| Puget Sound Salish | 100.0 /100 | #19 | Exceptional 0.97% |
| Nepalese | 100.0 /100 | #20 | Exceptional 0.97% |
| British West Indians | 100.0 /100 | #21 | Exceptional 0.99% |
| Immigrants | Iran | 100.0 /100 | #22 | Exceptional 1.00% |
| Yakama | 100.0 /100 | #23 | Exceptional 1.00% |
| Indians (Asian) | 100.0 /100 | #24 | Exceptional 1.0% |
| Immigrants | Micronesia | 100.0 /100 | #25 | Exceptional 1.0% |