French vs Asian Householder Income Ages 45 - 64 years
COMPARE
French
Asian
Householder Income Ages 45 - 64 years
Householder Income Ages 45 - 64 years Comparison
French
Asians
$99,824
HOUSEHOLDER INCOME AGES 45 - 64 YEARS
43.8/ 100
METRIC RATING
184th/ 347
METRIC RANK
$118,426
HOUSEHOLDER INCOME AGES 45 - 64 YEARS
100.0/ 100
METRIC RATING
25th/ 347
METRIC RANK
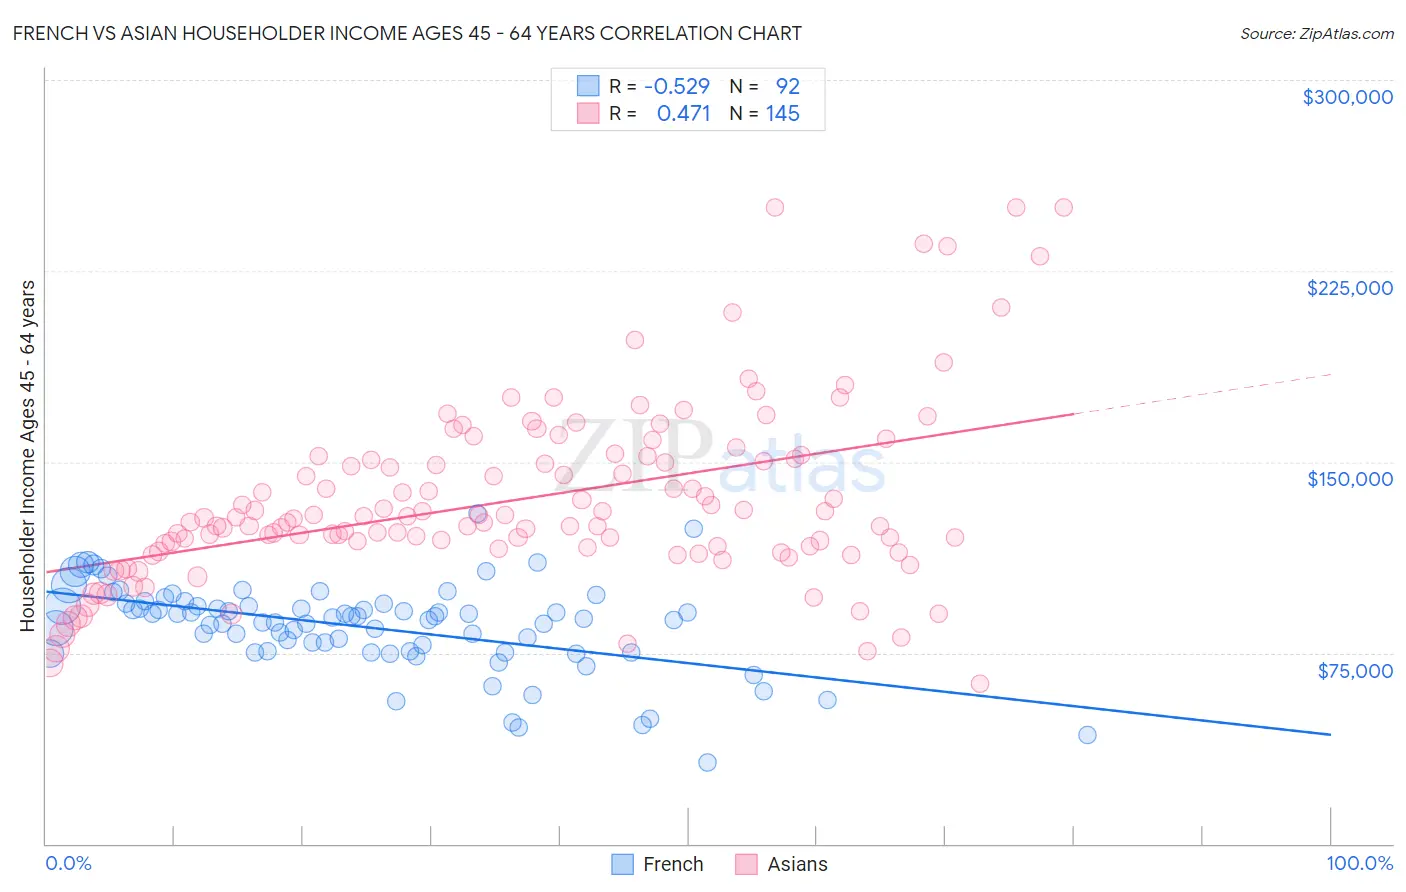
French vs Asian Householder Income Ages 45 - 64 years Correlation Chart
The statistical analysis conducted on geographies consisting of 568,632,779 people shows a substantial negative correlation between the proportion of French and household income with householder between the ages 45 and 64 in the United States with a correlation coefficient (R) of -0.529 and weighted average of $99,824. Similarly, the statistical analysis conducted on geographies consisting of 548,262,581 people shows a moderate positive correlation between the proportion of Asians and household income with householder between the ages 45 and 64 in the United States with a correlation coefficient (R) of 0.471 and weighted average of $118,426, a difference of 18.6%.
Householder Income Ages 45 - 64 years Correlation Summary
| Measurement | French | Asian |
| Minimum | $32,031 | $62,982 |
| Maximum | $129,396 | $250,001 |
| Range | $97,365 | $187,019 |
| Mean | $85,264 | $135,000 |
| Median | $88,490 | $127,763 |
| Interquartile 25% (IQ1) | $75,583 | $116,265 |
| Interquartile 75% (IQ3) | $93,777 | $151,736 |
| Interquartile Range (IQR) | $18,194 | $35,471 |
| Standard Deviation (Sample) | $17,163 | $35,213 |
| Standard Deviation (Population) | $17,070 | $35,092 |
Similar Demographics by Householder Income Ages 45 - 64 years
Demographics Similar to French by Householder Income Ages 45 - 64 years
In terms of householder income ages 45 - 64 years, the demographic groups most similar to French are Colombian ($99,772, a difference of 0.050%), Spaniard ($99,889, a difference of 0.070%), Finnish ($99,904, a difference of 0.080%), Immigrants ($99,943, a difference of 0.12%), and Dutch ($99,650, a difference of 0.17%).
| Demographics | Rating | Rank | Householder Income Ages 45 - 64 years |
| Moroccans | 47.7 /100 | #177 | Average $100,138 |
| Immigrants | Cameroon | 47.0 /100 | #178 | Average $100,084 |
| Belgians | 46.7 /100 | #179 | Average $100,060 |
| Aleuts | 46.6 /100 | #180 | Average $100,052 |
| Immigrants | Immigrants | 45.3 /100 | #181 | Average $99,943 |
| Finns | 44.8 /100 | #182 | Average $99,904 |
| Spaniards | 44.6 /100 | #183 | Average $99,889 |
| French | 43.8 /100 | #184 | Average $99,824 |
| Colombians | 43.2 /100 | #185 | Average $99,772 |
| Dutch | 41.7 /100 | #186 | Average $99,650 |
| Iraqis | 38.5 /100 | #187 | Fair $99,387 |
| Immigrants | Portugal | 36.3 /100 | #188 | Fair $99,203 |
| Immigrants | South America | 35.4 /100 | #189 | Fair $99,126 |
| French Canadians | 35.1 /100 | #190 | Fair $99,093 |
| Kenyans | 33.7 /100 | #191 | Fair $98,970 |
Demographics Similar to Asians by Householder Income Ages 45 - 64 years
In terms of householder income ages 45 - 64 years, the demographic groups most similar to Asians are Immigrants from Japan ($118,498, a difference of 0.060%), Immigrants from Sweden ($118,318, a difference of 0.090%), Bolivian ($118,871, a difference of 0.38%), Immigrants from Northern Europe ($117,930, a difference of 0.42%), and Immigrants from Belgium ($118,932, a difference of 0.43%).
| Demographics | Rating | Rank | Householder Income Ages 45 - 64 years |
| Immigrants | Korea | 100.0 /100 | #18 | Exceptional $121,243 |
| Eastern Europeans | 100.0 /100 | #19 | Exceptional $120,684 |
| Immigrants | Australia | 100.0 /100 | #20 | Exceptional $119,308 |
| Immigrants | Sri Lanka | 100.0 /100 | #21 | Exceptional $119,094 |
| Immigrants | Belgium | 100.0 /100 | #22 | Exceptional $118,932 |
| Bolivians | 100.0 /100 | #23 | Exceptional $118,871 |
| Immigrants | Japan | 100.0 /100 | #24 | Exceptional $118,498 |
| Asians | 100.0 /100 | #25 | Exceptional $118,426 |
| Immigrants | Sweden | 100.0 /100 | #26 | Exceptional $118,318 |
| Immigrants | Northern Europe | 100.0 /100 | #27 | Exceptional $117,930 |
| Turks | 100.0 /100 | #28 | Exceptional $117,814 |
| Bhutanese | 100.0 /100 | #29 | Exceptional $117,750 |
| Immigrants | Bolivia | 100.0 /100 | #30 | Exceptional $117,731 |
| Immigrants | Asia | 100.0 /100 | #31 | Exceptional $116,566 |
| Russians | 100.0 /100 | #32 | Exceptional $116,328 |