Potawatomi vs Asian Disability Age 5 to 17
COMPARE
Potawatomi
Asian
Disability Age 5 to 17
Disability Age 5 to 17 Comparison
Potawatomi
Asians
6.5%
DISABILITY AGE 5 TO 17
0.0/ 100
METRIC RATING
326th/ 347
METRIC RANK
4.8%
DISABILITY AGE 5 TO 17
100.0/ 100
METRIC RATING
22nd/ 347
METRIC RANK
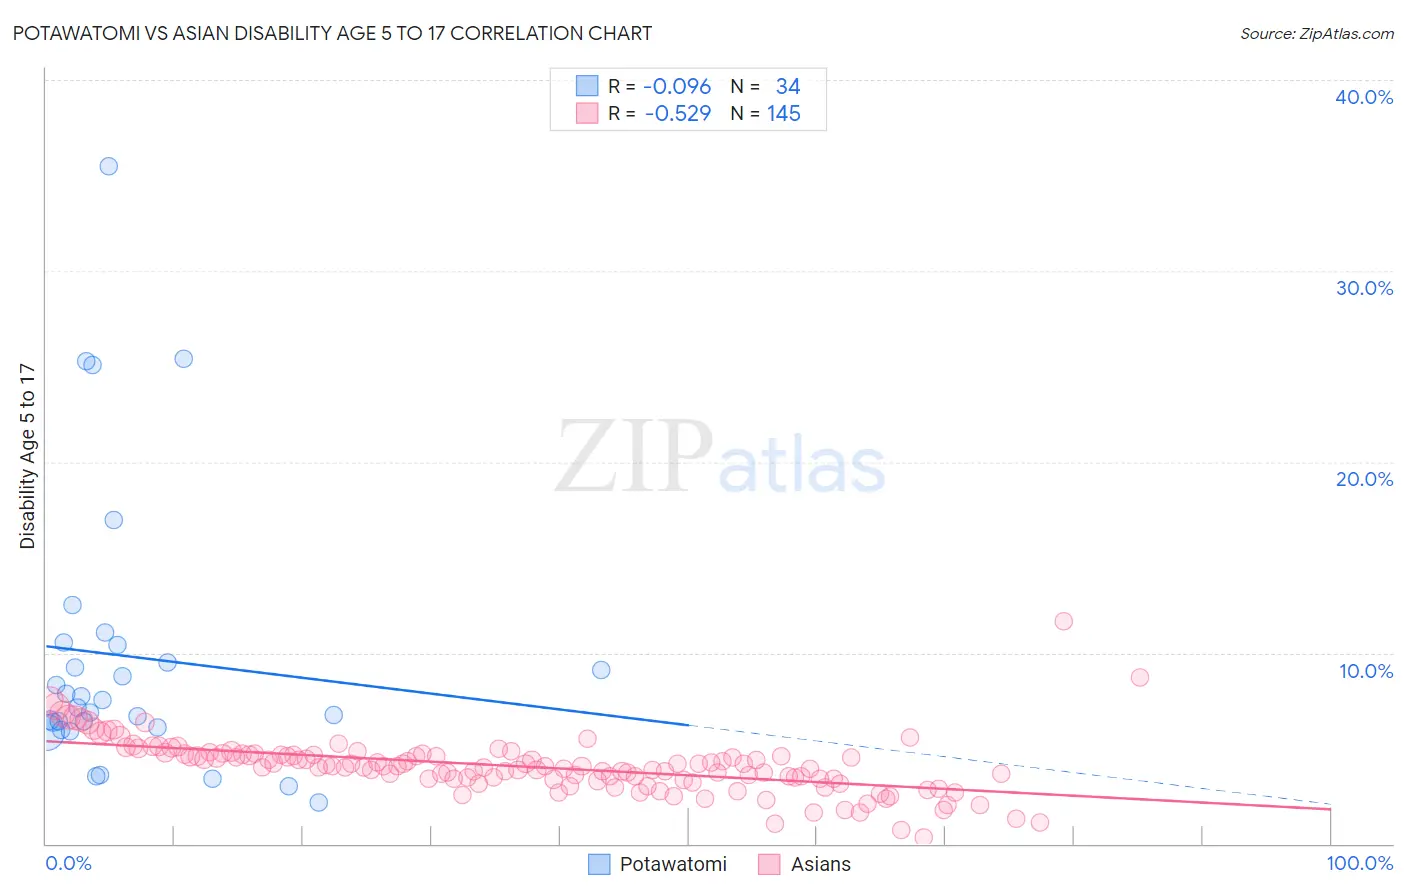
Potawatomi vs Asian Disability Age 5 to 17 Correlation Chart
The statistical analysis conducted on geographies consisting of 117,332,661 people shows a slight negative correlation between the proportion of Potawatomi and percentage of population with a disability between the ages 5 and 17 in the United States with a correlation coefficient (R) of -0.096 and weighted average of 6.5%. Similarly, the statistical analysis conducted on geographies consisting of 540,712,205 people shows a substantial negative correlation between the proportion of Asians and percentage of population with a disability between the ages 5 and 17 in the United States with a correlation coefficient (R) of -0.529 and weighted average of 4.8%, a difference of 36.0%.
Disability Age 5 to 17 Correlation Summary
| Measurement | Potawatomi | Asian |
| Minimum | 2.2% | 0.35% |
| Maximum | 35.5% | 11.7% |
| Range | 33.3% | 11.3% |
| Mean | 9.8% | 4.1% |
| Median | 7.3% | 4.1% |
| Interquartile 25% (IQ1) | 6.1% | 3.4% |
| Interquartile 75% (IQ3) | 10.4% | 4.7% |
| Interquartile Range (IQR) | 4.3% | 1.3% |
| Standard Deviation (Sample) | 7.4% | 1.5% |
| Standard Deviation (Population) | 7.3% | 1.5% |
Similar Demographics by Disability Age 5 to 17
Demographics Similar to Potawatomi by Disability Age 5 to 17
In terms of disability age 5 to 17, the demographic groups most similar to Potawatomi are American (6.5%, a difference of 0.13%), Dominican (6.5%, a difference of 0.19%), Osage (6.5%, a difference of 0.27%), Slovak (6.5%, a difference of 0.31%), and Tohono O'odham (6.5%, a difference of 0.32%).
| Demographics | Rating | Rank | Disability Age 5 to 17 |
| Delaware | 0.0 /100 | #319 | Tragic 6.5% |
| Africans | 0.0 /100 | #320 | Tragic 6.5% |
| Tohono O'odham | 0.0 /100 | #321 | Tragic 6.5% |
| Slovaks | 0.0 /100 | #322 | Tragic 6.5% |
| Osage | 0.0 /100 | #323 | Tragic 6.5% |
| Dominicans | 0.0 /100 | #324 | Tragic 6.5% |
| Americans | 0.0 /100 | #325 | Tragic 6.5% |
| Potawatomi | 0.0 /100 | #326 | Tragic 6.5% |
| French American Indians | 0.0 /100 | #327 | Tragic 6.6% |
| Pennsylvania Germans | 0.0 /100 | #328 | Tragic 6.6% |
| Blackfeet | 0.0 /100 | #329 | Tragic 6.6% |
| Dutch West Indians | 0.0 /100 | #330 | Tragic 6.7% |
| French Canadians | 0.0 /100 | #331 | Tragic 6.7% |
| Immigrants | Azores | 0.0 /100 | #332 | Tragic 6.7% |
| Blacks/African Americans | 0.0 /100 | #333 | Tragic 6.8% |
Demographics Similar to Asians by Disability Age 5 to 17
In terms of disability age 5 to 17, the demographic groups most similar to Asians are Yup'ik (4.8%, a difference of 0.34%), Burmese (4.8%, a difference of 0.56%), Immigrants from Bolivia (4.8%, a difference of 0.66%), Immigrants from Lebanon (4.8%, a difference of 0.81%), and Immigrants from Asia (4.8%, a difference of 0.92%).
| Demographics | Rating | Rank | Disability Age 5 to 17 |
| Chinese | 100.0 /100 | #15 | Exceptional 4.7% |
| Immigrants | Singapore | 100.0 /100 | #16 | Exceptional 4.7% |
| Arapaho | 100.0 /100 | #17 | Exceptional 4.7% |
| Immigrants | South Central Asia | 100.0 /100 | #18 | Exceptional 4.7% |
| Immigrants | Uzbekistan | 100.0 /100 | #19 | Exceptional 4.8% |
| Burmese | 100.0 /100 | #20 | Exceptional 4.8% |
| Yup'ik | 100.0 /100 | #21 | Exceptional 4.8% |
| Asians | 100.0 /100 | #22 | Exceptional 4.8% |
| Immigrants | Bolivia | 100.0 /100 | #23 | Exceptional 4.8% |
| Immigrants | Lebanon | 100.0 /100 | #24 | Exceptional 4.8% |
| Immigrants | Asia | 100.0 /100 | #25 | Exceptional 4.8% |
| Bhutanese | 100.0 /100 | #26 | Exceptional 4.9% |
| Taiwanese | 100.0 /100 | #27 | Exceptional 4.9% |
| Immigrants | Japan | 100.0 /100 | #28 | Exceptional 4.9% |
| Immigrants | Serbia | 100.0 /100 | #29 | Exceptional 4.9% |