Finnish vs Inupiat Male Disability
COMPARE
Finnish
Inupiat
Male Disability
Male Disability Comparison
Finns
Inupiat
12.6%
MALE DISABILITY
0.0/ 100
METRIC RATING
277th/ 347
METRIC RANK
13.0%
MALE DISABILITY
0.0/ 100
METRIC RATING
297th/ 347
METRIC RANK
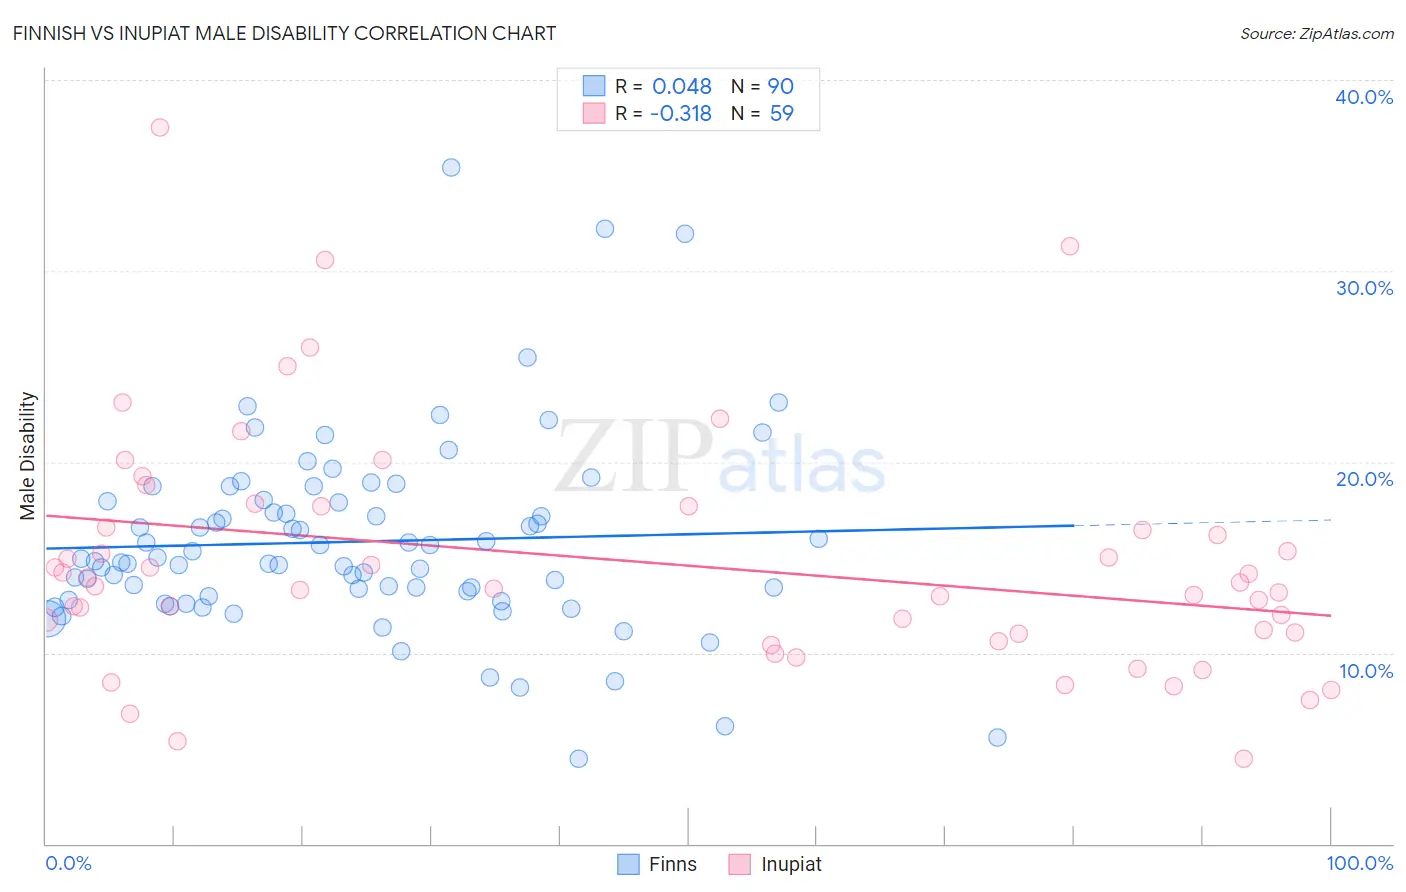
Finnish vs Inupiat Male Disability Correlation Chart
The statistical analysis conducted on geographies consisting of 404,606,067 people shows no correlation between the proportion of Finns and percentage of males with a disability in the United States with a correlation coefficient (R) of 0.048 and weighted average of 12.6%. Similarly, the statistical analysis conducted on geographies consisting of 96,329,518 people shows a mild negative correlation between the proportion of Inupiat and percentage of males with a disability in the United States with a correlation coefficient (R) of -0.318 and weighted average of 13.0%, a difference of 2.7%.
Male Disability Correlation Summary
| Measurement | Finnish | Inupiat |
| Minimum | 4.5% | 4.5% |
| Maximum | 35.4% | 37.5% |
| Range | 30.9% | 33.0% |
| Mean | 15.8% | 14.8% |
| Median | 14.9% | 13.5% |
| Interquartile 25% (IQ1) | 12.9% | 11.0% |
| Interquartile 75% (IQ3) | 18.0% | 17.6% |
| Interquartile Range (IQR) | 5.0% | 6.7% |
| Standard Deviation (Sample) | 5.0% | 6.3% |
| Standard Deviation (Population) | 5.0% | 6.2% |
Demographics Similar to Finns and Inupiat by Male Disability
In terms of male disability, the demographic groups most similar to Finns are Central American Indian (12.7%, a difference of 0.50%), Slovak (12.7%, a difference of 0.65%), Dutch (12.7%, a difference of 0.70%), Sioux (12.7%, a difference of 0.76%), and Irish (12.7%, a difference of 0.81%). Similarly, the demographic groups most similar to Inupiat are Nonimmigrants (12.9%, a difference of 0.11%), Immigrants from Micronesia (12.9%, a difference of 0.17%), Marshallese (12.9%, a difference of 0.27%), Yaqui (12.9%, a difference of 0.51%), and English (12.8%, a difference of 0.80%).
| Demographics | Rating | Rank | Male Disability |
| Finns | 0.0 /100 | #277 | Tragic 12.6% |
| Central American Indians | 0.0 /100 | #278 | Tragic 12.7% |
| Slovaks | 0.0 /100 | #279 | Tragic 12.7% |
| Dutch | 0.0 /100 | #280 | Tragic 12.7% |
| Sioux | 0.0 /100 | #281 | Tragic 12.7% |
| Irish | 0.0 /100 | #282 | Tragic 12.7% |
| Germans | 0.0 /100 | #283 | Tragic 12.7% |
| Spanish | 0.0 /100 | #284 | Tragic 12.7% |
| Welsh | 0.0 /100 | #285 | Tragic 12.7% |
| Scottish | 0.0 /100 | #286 | Tragic 12.8% |
| Cape Verdeans | 0.0 /100 | #287 | Tragic 12.8% |
| Yup'ik | 0.0 /100 | #288 | Tragic 12.8% |
| Immigrants | Cabo Verde | 0.0 /100 | #289 | Tragic 12.8% |
| Pima | 0.0 /100 | #290 | Tragic 12.8% |
| Whites/Caucasians | 0.0 /100 | #291 | Tragic 12.8% |
| English | 0.0 /100 | #292 | Tragic 12.8% |
| Yaqui | 0.0 /100 | #293 | Tragic 12.9% |
| Marshallese | 0.0 /100 | #294 | Tragic 12.9% |
| Immigrants | Micronesia | 0.0 /100 | #295 | Tragic 12.9% |
| Immigrants | Nonimmigrants | 0.0 /100 | #296 | Tragic 12.9% |
| Inupiat | 0.0 /100 | #297 | Tragic 13.0% |