Finnish vs Creek Male Disability
COMPARE
Finnish
Creek
Male Disability
Male Disability Comparison
Finns
Creek
12.6%
MALE DISABILITY
0.0/ 100
METRIC RATING
277th/ 347
METRIC RANK
15.5%
MALE DISABILITY
0.0/ 100
METRIC RATING
343rd/ 347
METRIC RANK
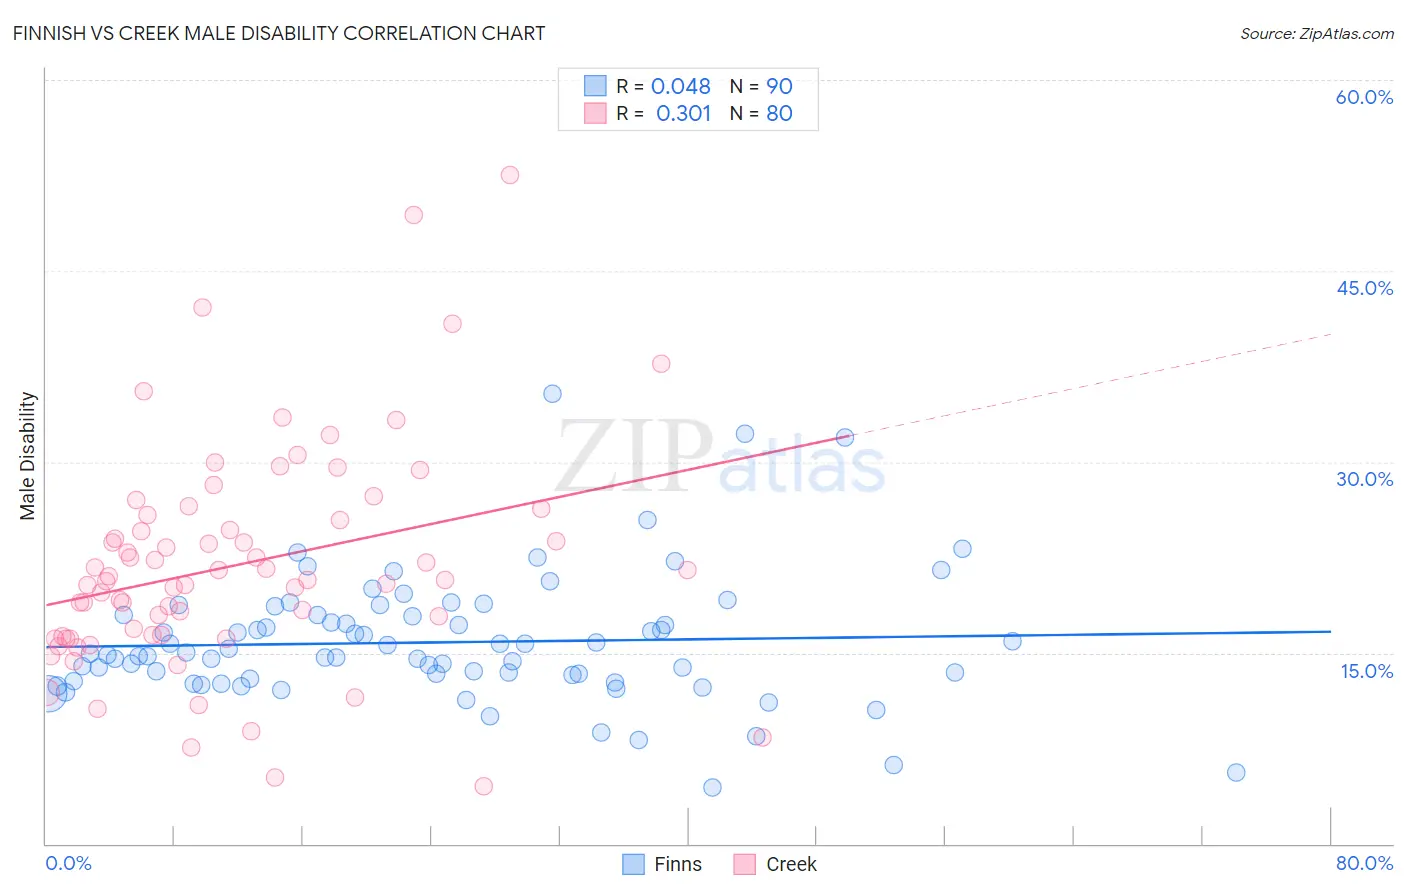
Finnish vs Creek Male Disability Correlation Chart
The statistical analysis conducted on geographies consisting of 404,606,067 people shows no correlation between the proportion of Finns and percentage of males with a disability in the United States with a correlation coefficient (R) of 0.048 and weighted average of 12.6%. Similarly, the statistical analysis conducted on geographies consisting of 178,460,797 people shows a mild positive correlation between the proportion of Creek and percentage of males with a disability in the United States with a correlation coefficient (R) of 0.301 and weighted average of 15.5%, a difference of 23.2%.
Male Disability Correlation Summary
| Measurement | Finnish | Creek |
| Minimum | 4.5% | 4.5% |
| Maximum | 35.4% | 52.5% |
| Range | 30.9% | 48.1% |
| Mean | 15.8% | 21.9% |
| Median | 14.9% | 20.7% |
| Interquartile 25% (IQ1) | 12.9% | 16.3% |
| Interquartile 75% (IQ3) | 18.0% | 25.6% |
| Interquartile Range (IQR) | 5.0% | 9.3% |
| Standard Deviation (Sample) | 5.0% | 8.7% |
| Standard Deviation (Population) | 5.0% | 8.7% |
Similar Demographics by Male Disability
Demographics Similar to Finns by Male Disability
In terms of male disability, the demographic groups most similar to Finns are African (12.6%, a difference of 0.31%), Fijian (12.6%, a difference of 0.37%), Central American Indian (12.7%, a difference of 0.50%), Slovak (12.7%, a difference of 0.65%), and Dutch (12.7%, a difference of 0.70%).
| Demographics | Rating | Rank | Male Disability |
| Spaniards | 0.1 /100 | #270 | Tragic 12.3% |
| Scandinavians | 0.1 /100 | #271 | Tragic 12.3% |
| Hmong | 0.0 /100 | #272 | Tragic 12.5% |
| Native Hawaiians | 0.0 /100 | #273 | Tragic 12.5% |
| Hopi | 0.0 /100 | #274 | Tragic 12.5% |
| Fijians | 0.0 /100 | #275 | Tragic 12.6% |
| Africans | 0.0 /100 | #276 | Tragic 12.6% |
| Finns | 0.0 /100 | #277 | Tragic 12.6% |
| Central American Indians | 0.0 /100 | #278 | Tragic 12.7% |
| Slovaks | 0.0 /100 | #279 | Tragic 12.7% |
| Dutch | 0.0 /100 | #280 | Tragic 12.7% |
| Sioux | 0.0 /100 | #281 | Tragic 12.7% |
| Irish | 0.0 /100 | #282 | Tragic 12.7% |
| Germans | 0.0 /100 | #283 | Tragic 12.7% |
| Spanish | 0.0 /100 | #284 | Tragic 12.7% |
Demographics Similar to Creek by Male Disability
In terms of male disability, the demographic groups most similar to Creek are Puerto Rican (15.6%, a difference of 0.13%), Tsimshian (15.6%, a difference of 0.45%), Kiowa (15.4%, a difference of 0.66%), Choctaw (15.4%, a difference of 0.85%), and Lumbee (15.2%, a difference of 2.0%).
| Demographics | Rating | Rank | Male Disability |
| Yuman | 0.0 /100 | #333 | Tragic 14.7% |
| Cherokee | 0.0 /100 | #334 | Tragic 14.8% |
| Dutch West Indians | 0.0 /100 | #335 | Tragic 14.8% |
| Alaskan Athabascans | 0.0 /100 | #336 | Tragic 14.9% |
| Menominee | 0.0 /100 | #337 | Tragic 15.0% |
| Pueblo | 0.0 /100 | #338 | Tragic 15.0% |
| Chickasaw | 0.0 /100 | #339 | Tragic 15.1% |
| Lumbee | 0.0 /100 | #340 | Tragic 15.2% |
| Choctaw | 0.0 /100 | #341 | Tragic 15.4% |
| Kiowa | 0.0 /100 | #342 | Tragic 15.4% |
| Creek | 0.0 /100 | #343 | Tragic 15.5% |
| Puerto Ricans | 0.0 /100 | #344 | Tragic 15.6% |
| Tsimshian | 0.0 /100 | #345 | Tragic 15.6% |
| Colville | 0.0 /100 | #346 | Tragic 16.5% |
| Houma | 0.0 /100 | #347 | Tragic 17.4% |