Finnish vs Peruvian Male Disability
COMPARE
Finnish
Peruvian
Male Disability
Male Disability Comparison
Finns
Peruvians
12.6%
MALE DISABILITY
0.0/ 100
METRIC RATING
277th/ 347
METRIC RANK
10.4%
MALE DISABILITY
99.6/ 100
METRIC RATING
54th/ 347
METRIC RANK
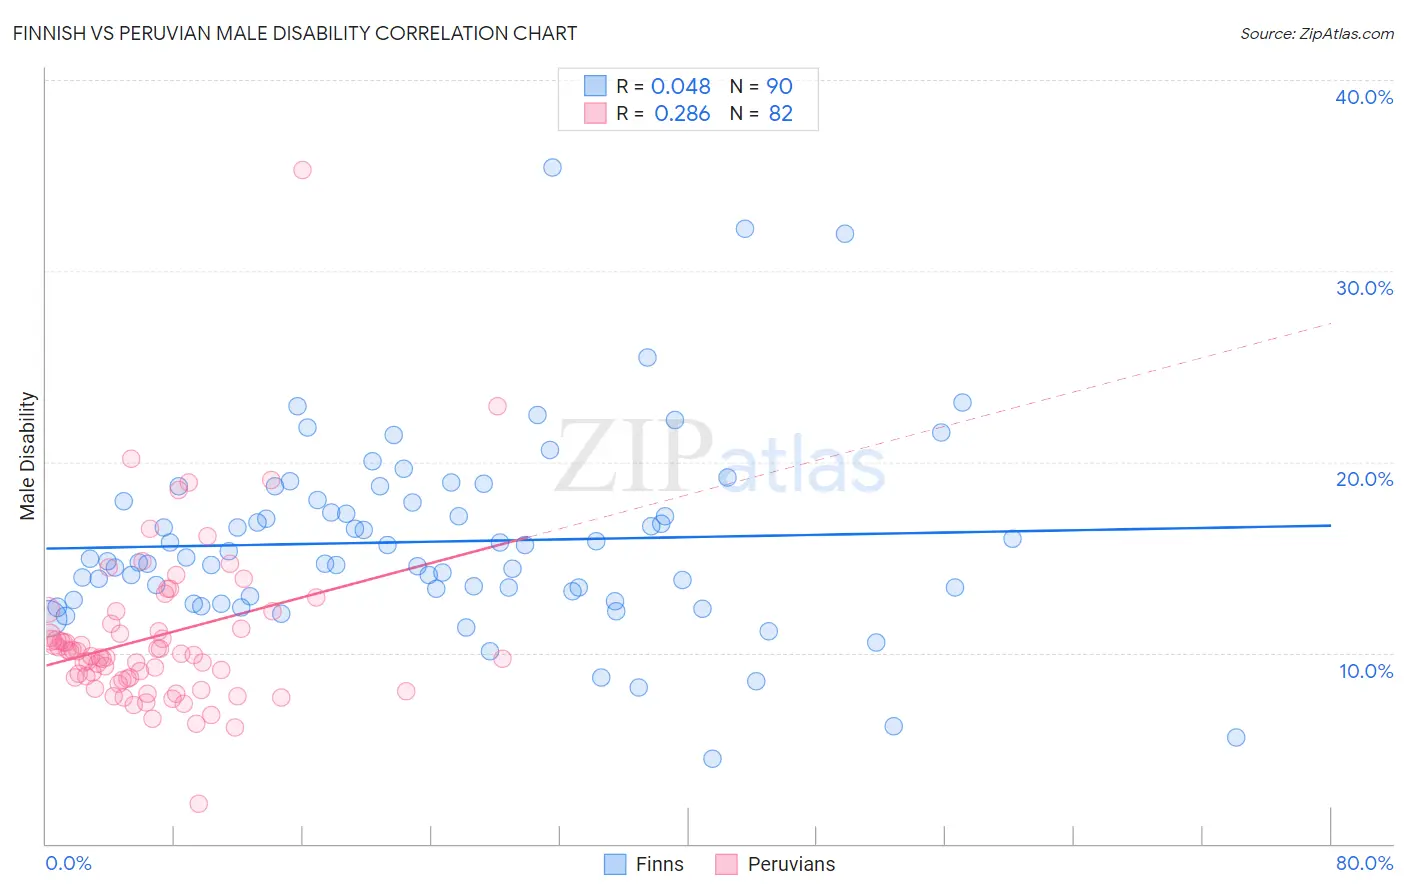
Finnish vs Peruvian Male Disability Correlation Chart
The statistical analysis conducted on geographies consisting of 404,606,067 people shows no correlation between the proportion of Finns and percentage of males with a disability in the United States with a correlation coefficient (R) of 0.048 and weighted average of 12.6%. Similarly, the statistical analysis conducted on geographies consisting of 363,183,994 people shows a weak positive correlation between the proportion of Peruvians and percentage of males with a disability in the United States with a correlation coefficient (R) of 0.286 and weighted average of 10.4%, a difference of 21.6%.
Male Disability Correlation Summary
| Measurement | Finnish | Peruvian |
| Minimum | 4.5% | 2.1% |
| Maximum | 35.4% | 35.3% |
| Range | 30.9% | 33.1% |
| Mean | 15.8% | 10.9% |
| Median | 14.9% | 9.9% |
| Interquartile 25% (IQ1) | 12.9% | 8.7% |
| Interquartile 75% (IQ3) | 18.0% | 11.5% |
| Interquartile Range (IQR) | 5.0% | 2.9% |
| Standard Deviation (Sample) | 5.0% | 4.3% |
| Standard Deviation (Population) | 5.0% | 4.3% |
Similar Demographics by Male Disability
Demographics Similar to Finns by Male Disability
In terms of male disability, the demographic groups most similar to Finns are African (12.6%, a difference of 0.31%), Fijian (12.6%, a difference of 0.37%), Central American Indian (12.7%, a difference of 0.50%), Slovak (12.7%, a difference of 0.65%), and Dutch (12.7%, a difference of 0.70%).
| Demographics | Rating | Rank | Male Disability |
| Spaniards | 0.1 /100 | #270 | Tragic 12.3% |
| Scandinavians | 0.1 /100 | #271 | Tragic 12.3% |
| Hmong | 0.0 /100 | #272 | Tragic 12.5% |
| Native Hawaiians | 0.0 /100 | #273 | Tragic 12.5% |
| Hopi | 0.0 /100 | #274 | Tragic 12.5% |
| Fijians | 0.0 /100 | #275 | Tragic 12.6% |
| Africans | 0.0 /100 | #276 | Tragic 12.6% |
| Finns | 0.0 /100 | #277 | Tragic 12.6% |
| Central American Indians | 0.0 /100 | #278 | Tragic 12.7% |
| Slovaks | 0.0 /100 | #279 | Tragic 12.7% |
| Dutch | 0.0 /100 | #280 | Tragic 12.7% |
| Sioux | 0.0 /100 | #281 | Tragic 12.7% |
| Irish | 0.0 /100 | #282 | Tragic 12.7% |
| Germans | 0.0 /100 | #283 | Tragic 12.7% |
| Spanish | 0.0 /100 | #284 | Tragic 12.7% |
Demographics Similar to Peruvians by Male Disability
In terms of male disability, the demographic groups most similar to Peruvians are Immigrants from Eritrea (10.4%, a difference of 0.020%), Immigrants from Uzbekistan (10.4%, a difference of 0.040%), Immigrants from Saudi Arabia (10.4%, a difference of 0.060%), Tongan (10.4%, a difference of 0.060%), and Salvadoran (10.4%, a difference of 0.080%).
| Demographics | Rating | Rank | Male Disability |
| Immigrants | Peru | 99.7 /100 | #47 | Exceptional 10.3% |
| Israelis | 99.7 /100 | #48 | Exceptional 10.3% |
| Immigrants | Spain | 99.7 /100 | #49 | Exceptional 10.3% |
| South Americans | 99.6 /100 | #50 | Exceptional 10.3% |
| Salvadorans | 99.6 /100 | #51 | Exceptional 10.4% |
| Immigrants | Saudi Arabia | 99.6 /100 | #52 | Exceptional 10.4% |
| Immigrants | Uzbekistan | 99.6 /100 | #53 | Exceptional 10.4% |
| Peruvians | 99.6 /100 | #54 | Exceptional 10.4% |
| Immigrants | Eritrea | 99.6 /100 | #55 | Exceptional 10.4% |
| Tongans | 99.6 /100 | #56 | Exceptional 10.4% |
| Immigrants | South America | 99.6 /100 | #57 | Exceptional 10.4% |
| Immigrants | Japan | 99.5 /100 | #58 | Exceptional 10.4% |
| Immigrants | Australia | 99.5 /100 | #59 | Exceptional 10.4% |
| Immigrants | Colombia | 99.5 /100 | #60 | Exceptional 10.4% |
| Immigrants | Northern Africa | 99.4 /100 | #61 | Exceptional 10.4% |