Finnish vs Hawaiian Male Disability
COMPARE
Finnish
Hawaiian
Male Disability
Male Disability Comparison
Finns
Hawaiians
12.6%
MALE DISABILITY
0.0/ 100
METRIC RATING
277th/ 347
METRIC RANK
12.3%
MALE DISABILITY
0.1/ 100
METRIC RATING
266th/ 347
METRIC RANK
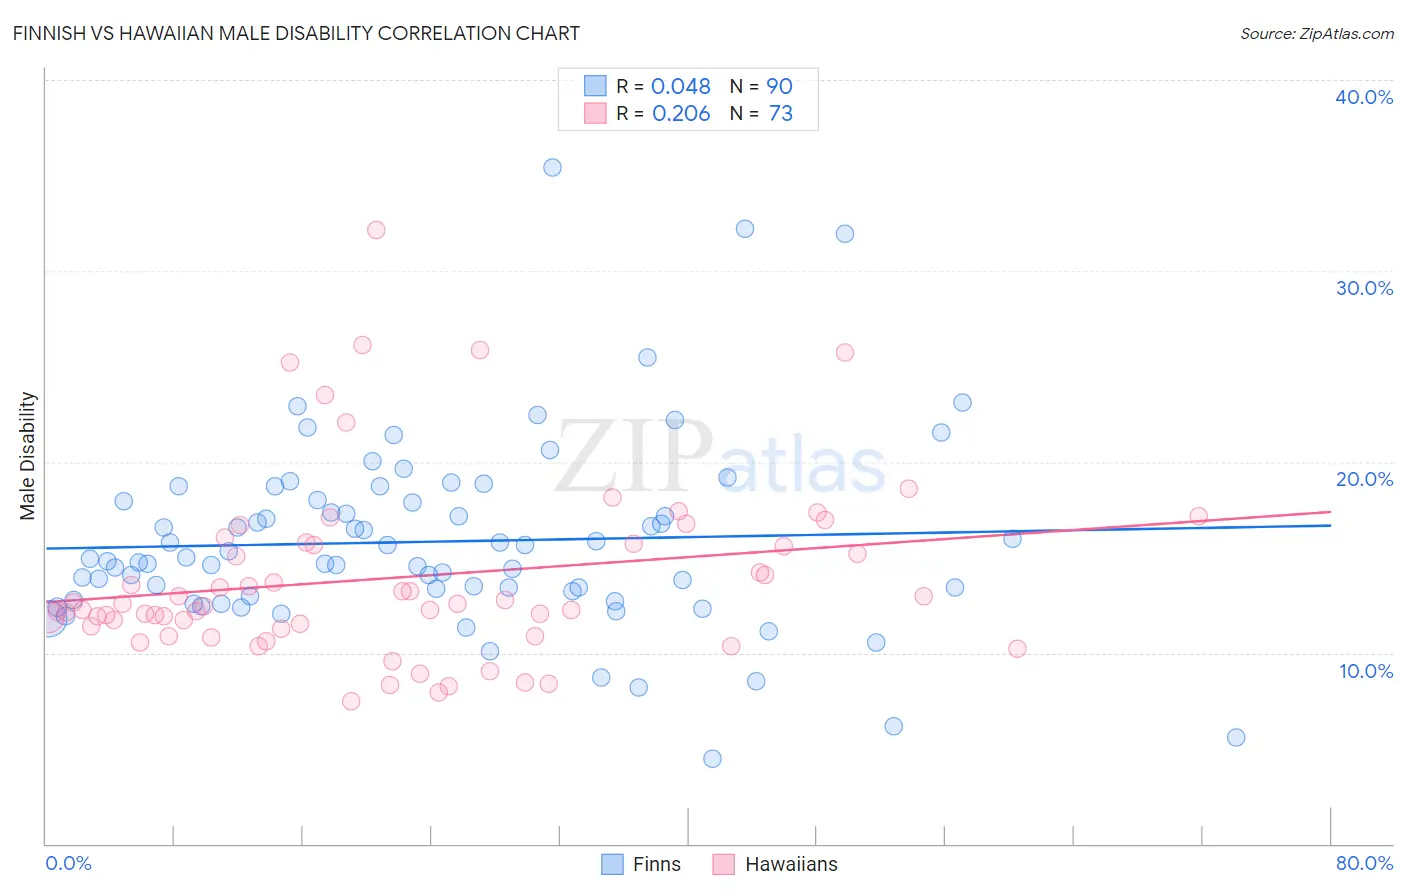
Finnish vs Hawaiian Male Disability Correlation Chart
The statistical analysis conducted on geographies consisting of 404,606,067 people shows no correlation between the proportion of Finns and percentage of males with a disability in the United States with a correlation coefficient (R) of 0.048 and weighted average of 12.6%. Similarly, the statistical analysis conducted on geographies consisting of 327,496,415 people shows a weak positive correlation between the proportion of Hawaiians and percentage of males with a disability in the United States with a correlation coefficient (R) of 0.206 and weighted average of 12.3%, a difference of 2.8%.
Male Disability Correlation Summary
| Measurement | Finnish | Hawaiian |
| Minimum | 4.5% | 7.5% |
| Maximum | 35.4% | 32.2% |
| Range | 30.9% | 24.7% |
| Mean | 15.8% | 14.0% |
| Median | 14.9% | 12.6% |
| Interquartile 25% (IQ1) | 12.9% | 11.3% |
| Interquartile 75% (IQ3) | 18.0% | 15.7% |
| Interquartile Range (IQR) | 5.0% | 4.4% |
| Standard Deviation (Sample) | 5.0% | 4.7% |
| Standard Deviation (Population) | 5.0% | 4.7% |
Demographics Similar to Finns and Hawaiians by Male Disability
In terms of male disability, the demographic groups most similar to Finns are African (12.6%, a difference of 0.31%), Fijian (12.6%, a difference of 0.37%), Central American Indian (12.7%, a difference of 0.50%), Slovak (12.7%, a difference of 0.65%), and Dutch (12.7%, a difference of 0.70%). Similarly, the demographic groups most similar to Hawaiians are Immigrants from Portugal (12.3%, a difference of 0.020%), Immigrants from Germany (12.3%, a difference of 0.050%), Portuguese (12.3%, a difference of 0.18%), Czechoslovakian (12.3%, a difference of 0.18%), and Spaniard (12.3%, a difference of 0.26%).
| Demographics | Rating | Rank | Male Disability |
| Slavs | 0.2 /100 | #261 | Tragic 12.2% |
| Norwegians | 0.2 /100 | #262 | Tragic 12.2% |
| Canadians | 0.2 /100 | #263 | Tragic 12.2% |
| Nepalese | 0.2 /100 | #264 | Tragic 12.2% |
| Immigrants | Portugal | 0.1 /100 | #265 | Tragic 12.3% |
| Hawaiians | 0.1 /100 | #266 | Tragic 12.3% |
| Immigrants | Germany | 0.1 /100 | #267 | Tragic 12.3% |
| Portuguese | 0.1 /100 | #268 | Tragic 12.3% |
| Czechoslovakians | 0.1 /100 | #269 | Tragic 12.3% |
| Spaniards | 0.1 /100 | #270 | Tragic 12.3% |
| Scandinavians | 0.1 /100 | #271 | Tragic 12.3% |
| Hmong | 0.0 /100 | #272 | Tragic 12.5% |
| Native Hawaiians | 0.0 /100 | #273 | Tragic 12.5% |
| Hopi | 0.0 /100 | #274 | Tragic 12.5% |
| Fijians | 0.0 /100 | #275 | Tragic 12.6% |
| Africans | 0.0 /100 | #276 | Tragic 12.6% |
| Finns | 0.0 /100 | #277 | Tragic 12.6% |
| Central American Indians | 0.0 /100 | #278 | Tragic 12.7% |
| Slovaks | 0.0 /100 | #279 | Tragic 12.7% |
| Dutch | 0.0 /100 | #280 | Tragic 12.7% |
| Sioux | 0.0 /100 | #281 | Tragic 12.7% |