Basque vs Inupiat Male Disability
COMPARE
Basque
Inupiat
Male Disability
Male Disability Comparison
Basques
Inupiat
12.1%
MALE DISABILITY
0.3/ 100
METRIC RATING
258th/ 347
METRIC RANK
13.0%
MALE DISABILITY
0.0/ 100
METRIC RATING
297th/ 347
METRIC RANK
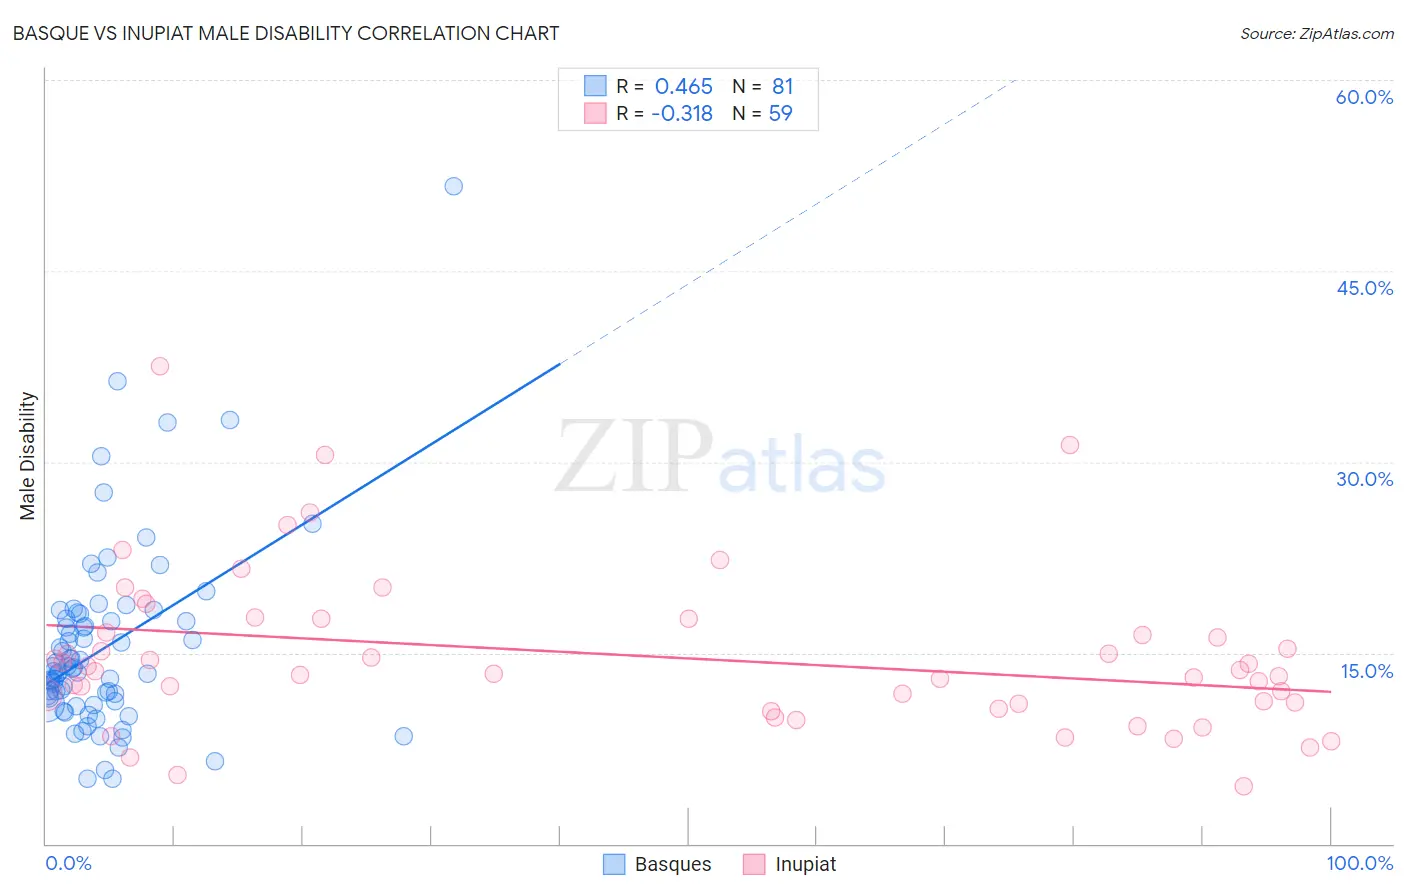
Basque vs Inupiat Male Disability Correlation Chart
The statistical analysis conducted on geographies consisting of 165,777,747 people shows a moderate positive correlation between the proportion of Basques and percentage of males with a disability in the United States with a correlation coefficient (R) of 0.465 and weighted average of 12.1%. Similarly, the statistical analysis conducted on geographies consisting of 96,329,518 people shows a mild negative correlation between the proportion of Inupiat and percentage of males with a disability in the United States with a correlation coefficient (R) of -0.318 and weighted average of 13.0%, a difference of 6.9%.
Male Disability Correlation Summary
| Measurement | Basque | Inupiat |
| Minimum | 5.1% | 4.5% |
| Maximum | 51.7% | 37.5% |
| Range | 46.6% | 33.0% |
| Mean | 15.4% | 14.8% |
| Median | 13.8% | 13.5% |
| Interquartile 25% (IQ1) | 11.1% | 11.0% |
| Interquartile 75% (IQ3) | 17.9% | 17.6% |
| Interquartile Range (IQR) | 6.7% | 6.7% |
| Standard Deviation (Sample) | 7.4% | 6.3% |
| Standard Deviation (Population) | 7.3% | 6.2% |
Similar Demographics by Male Disability
Demographics Similar to Basques by Male Disability
In terms of male disability, the demographic groups most similar to Basques are Belgian (12.1%, a difference of 0.040%), Swedish (12.1%, a difference of 0.12%), Swiss (12.1%, a difference of 0.19%), European (12.1%, a difference of 0.19%), and Chinese (12.1%, a difference of 0.44%).
| Demographics | Rating | Rank | Male Disability |
| German Russians | 0.5 /100 | #251 | Tragic 12.0% |
| Slovenes | 0.5 /100 | #252 | Tragic 12.0% |
| Guamanians/Chamorros | 0.5 /100 | #253 | Tragic 12.0% |
| British | 0.4 /100 | #254 | Tragic 12.1% |
| Chinese | 0.4 /100 | #255 | Tragic 12.1% |
| Swiss | 0.3 /100 | #256 | Tragic 12.1% |
| Europeans | 0.3 /100 | #257 | Tragic 12.1% |
| Basques | 0.3 /100 | #258 | Tragic 12.1% |
| Belgians | 0.3 /100 | #259 | Tragic 12.1% |
| Swedes | 0.3 /100 | #260 | Tragic 12.1% |
| Slavs | 0.2 /100 | #261 | Tragic 12.2% |
| Norwegians | 0.2 /100 | #262 | Tragic 12.2% |
| Canadians | 0.2 /100 | #263 | Tragic 12.2% |
| Nepalese | 0.2 /100 | #264 | Tragic 12.2% |
| Immigrants | Portugal | 0.1 /100 | #265 | Tragic 12.3% |
Demographics Similar to Inupiat by Male Disability
In terms of male disability, the demographic groups most similar to Inupiat are Nonimmigrants (12.9%, a difference of 0.11%), Immigrants from Micronesia (12.9%, a difference of 0.17%), Pennsylvania German (13.0%, a difference of 0.20%), Marshallese (12.9%, a difference of 0.27%), and Yaqui (12.9%, a difference of 0.51%).
| Demographics | Rating | Rank | Male Disability |
| Pima | 0.0 /100 | #290 | Tragic 12.8% |
| Whites/Caucasians | 0.0 /100 | #291 | Tragic 12.8% |
| English | 0.0 /100 | #292 | Tragic 12.8% |
| Yaqui | 0.0 /100 | #293 | Tragic 12.9% |
| Marshallese | 0.0 /100 | #294 | Tragic 12.9% |
| Immigrants | Micronesia | 0.0 /100 | #295 | Tragic 12.9% |
| Immigrants | Nonimmigrants | 0.0 /100 | #296 | Tragic 12.9% |
| Inupiat | 0.0 /100 | #297 | Tragic 13.0% |
| Pennsylvania Germans | 0.0 /100 | #298 | Tragic 13.0% |
| Celtics | 0.0 /100 | #299 | Tragic 13.0% |
| Cheyenne | 0.0 /100 | #300 | Tragic 13.0% |
| French | 0.0 /100 | #301 | Tragic 13.0% |
| Crow | 0.0 /100 | #302 | Tragic 13.1% |
| Scotch-Irish | 0.0 /100 | #303 | Tragic 13.2% |
| Blacks/African Americans | 0.0 /100 | #304 | Tragic 13.2% |