Finnish vs Crow Male Disability
COMPARE
Finnish
Crow
Male Disability
Male Disability Comparison
Finns
Crow
12.6%
MALE DISABILITY
0.0/ 100
METRIC RATING
277th/ 347
METRIC RANK
13.1%
MALE DISABILITY
0.0/ 100
METRIC RATING
302nd/ 347
METRIC RANK
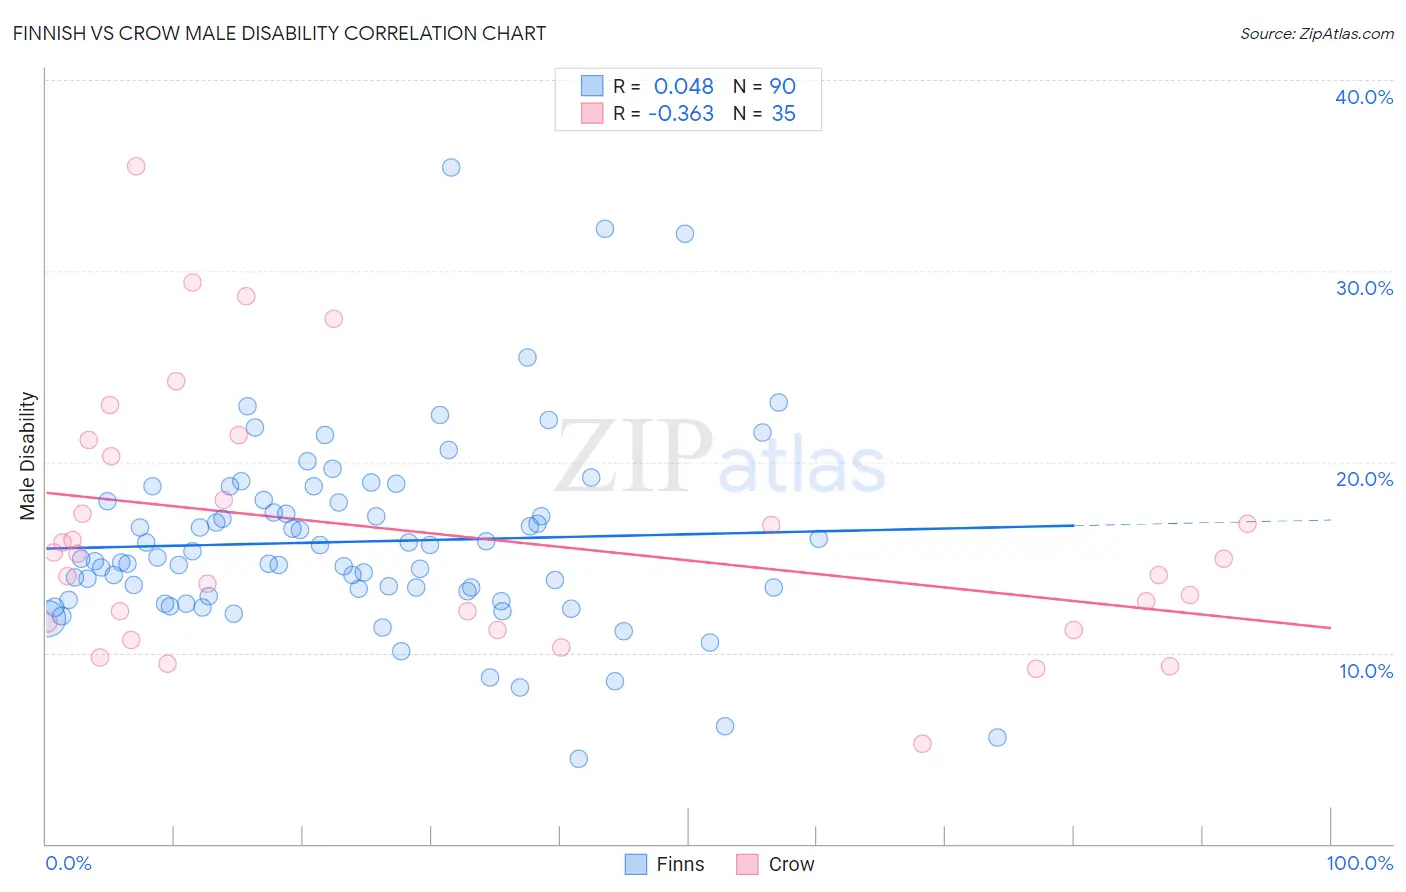
Finnish vs Crow Male Disability Correlation Chart
The statistical analysis conducted on geographies consisting of 404,606,067 people shows no correlation between the proportion of Finns and percentage of males with a disability in the United States with a correlation coefficient (R) of 0.048 and weighted average of 12.6%. Similarly, the statistical analysis conducted on geographies consisting of 59,204,441 people shows a mild negative correlation between the proportion of Crow and percentage of males with a disability in the United States with a correlation coefficient (R) of -0.363 and weighted average of 13.1%, a difference of 4.0%.
Male Disability Correlation Summary
| Measurement | Finnish | Crow |
| Minimum | 4.5% | 5.2% |
| Maximum | 35.4% | 35.5% |
| Range | 30.9% | 30.2% |
| Mean | 15.8% | 16.2% |
| Median | 14.9% | 14.9% |
| Interquartile 25% (IQ1) | 12.9% | 11.2% |
| Interquartile 75% (IQ3) | 18.0% | 20.3% |
| Interquartile Range (IQR) | 5.0% | 9.1% |
| Standard Deviation (Sample) | 5.0% | 6.7% |
| Standard Deviation (Population) | 5.0% | 6.6% |
Similar Demographics by Male Disability
Demographics Similar to Finns by Male Disability
In terms of male disability, the demographic groups most similar to Finns are African (12.6%, a difference of 0.31%), Fijian (12.6%, a difference of 0.37%), Central American Indian (12.7%, a difference of 0.50%), Slovak (12.7%, a difference of 0.65%), and Dutch (12.7%, a difference of 0.70%).
| Demographics | Rating | Rank | Male Disability |
| Spaniards | 0.1 /100 | #270 | Tragic 12.3% |
| Scandinavians | 0.1 /100 | #271 | Tragic 12.3% |
| Hmong | 0.0 /100 | #272 | Tragic 12.5% |
| Native Hawaiians | 0.0 /100 | #273 | Tragic 12.5% |
| Hopi | 0.0 /100 | #274 | Tragic 12.5% |
| Fijians | 0.0 /100 | #275 | Tragic 12.6% |
| Africans | 0.0 /100 | #276 | Tragic 12.6% |
| Finns | 0.0 /100 | #277 | Tragic 12.6% |
| Central American Indians | 0.0 /100 | #278 | Tragic 12.7% |
| Slovaks | 0.0 /100 | #279 | Tragic 12.7% |
| Dutch | 0.0 /100 | #280 | Tragic 12.7% |
| Sioux | 0.0 /100 | #281 | Tragic 12.7% |
| Irish | 0.0 /100 | #282 | Tragic 12.7% |
| Germans | 0.0 /100 | #283 | Tragic 12.7% |
| Spanish | 0.0 /100 | #284 | Tragic 12.7% |
Demographics Similar to Crow by Male Disability
In terms of male disability, the demographic groups most similar to Crow are Scotch-Irish (13.2%, a difference of 0.54%), French (13.0%, a difference of 0.58%), Cheyenne (13.0%, a difference of 0.63%), Celtic (13.0%, a difference of 0.72%), and Black/African American (13.2%, a difference of 0.87%).
| Demographics | Rating | Rank | Male Disability |
| Immigrants | Micronesia | 0.0 /100 | #295 | Tragic 12.9% |
| Immigrants | Nonimmigrants | 0.0 /100 | #296 | Tragic 12.9% |
| Inupiat | 0.0 /100 | #297 | Tragic 13.0% |
| Pennsylvania Germans | 0.0 /100 | #298 | Tragic 13.0% |
| Celtics | 0.0 /100 | #299 | Tragic 13.0% |
| Cheyenne | 0.0 /100 | #300 | Tragic 13.0% |
| French | 0.0 /100 | #301 | Tragic 13.0% |
| Crow | 0.0 /100 | #302 | Tragic 13.1% |
| Scotch-Irish | 0.0 /100 | #303 | Tragic 13.2% |
| Blacks/African Americans | 0.0 /100 | #304 | Tragic 13.2% |
| French Canadians | 0.0 /100 | #305 | Tragic 13.3% |
| Spanish Americans | 0.0 /100 | #306 | Tragic 13.3% |
| Arapaho | 0.0 /100 | #307 | Tragic 13.3% |
| French American Indians | 0.0 /100 | #308 | Tragic 13.4% |
| Blackfeet | 0.0 /100 | #309 | Tragic 13.4% |