Immigrants from Middle Africa vs Inupiat Male Disability
COMPARE
Immigrants from Middle Africa
Inupiat
Male Disability
Male Disability Comparison
Immigrants from Middle Africa
Inupiat
11.1%
MALE DISABILITY
70.9/ 100
METRIC RATING
155th/ 347
METRIC RANK
13.0%
MALE DISABILITY
0.0/ 100
METRIC RATING
297th/ 347
METRIC RANK
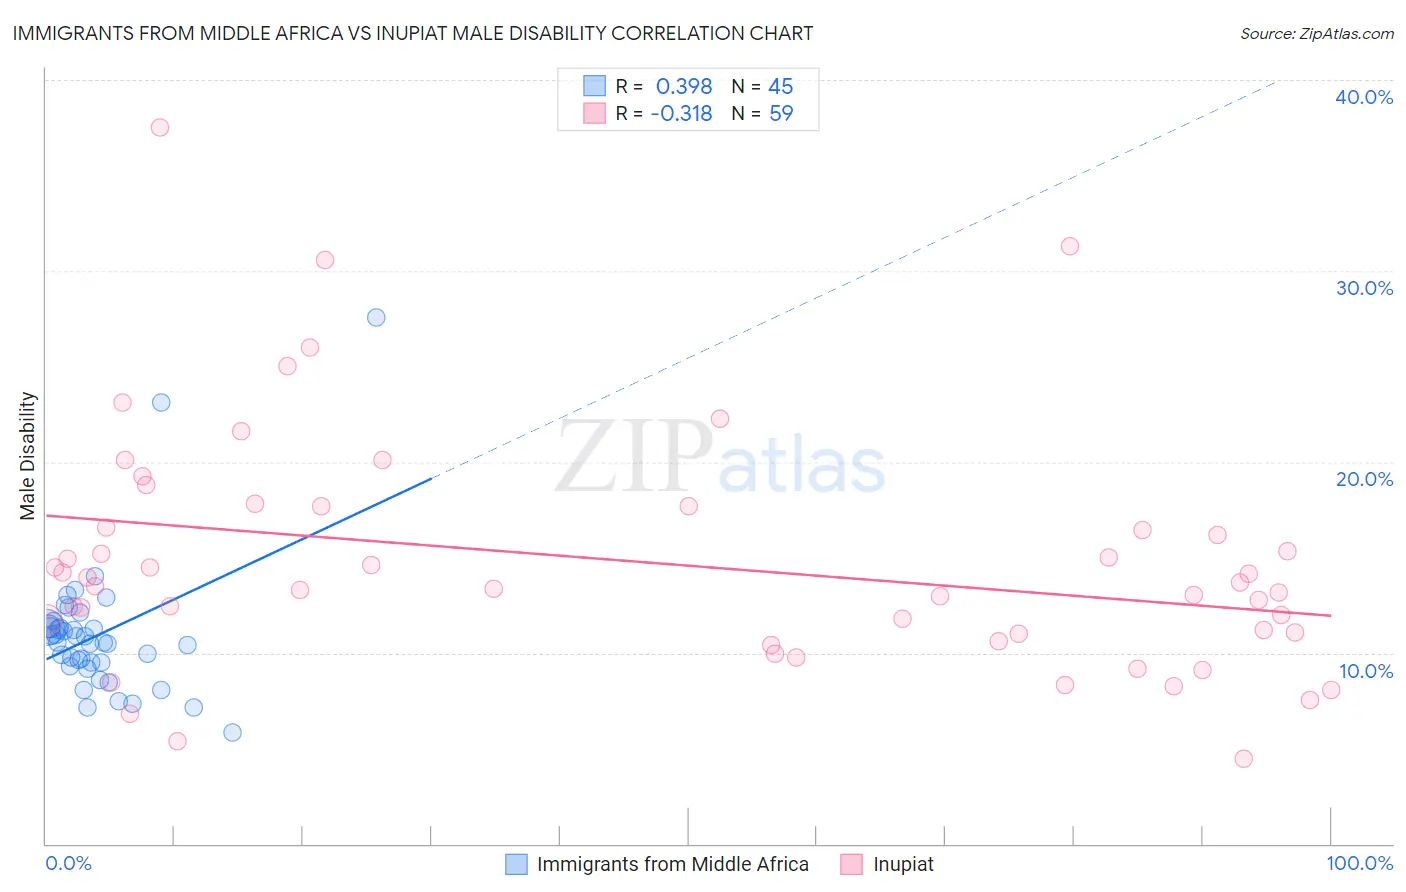
Immigrants from Middle Africa vs Inupiat Male Disability Correlation Chart
The statistical analysis conducted on geographies consisting of 202,727,084 people shows a mild positive correlation between the proportion of Immigrants from Middle Africa and percentage of males with a disability in the United States with a correlation coefficient (R) of 0.398 and weighted average of 11.1%. Similarly, the statistical analysis conducted on geographies consisting of 96,329,518 people shows a mild negative correlation between the proportion of Inupiat and percentage of males with a disability in the United States with a correlation coefficient (R) of -0.318 and weighted average of 13.0%, a difference of 16.9%.
Male Disability Correlation Summary
| Measurement | Immigrants from Middle Africa | Inupiat |
| Minimum | 5.8% | 4.5% |
| Maximum | 27.6% | 37.5% |
| Range | 21.8% | 33.0% |
| Mean | 11.0% | 14.8% |
| Median | 10.5% | 13.5% |
| Interquartile 25% (IQ1) | 9.4% | 11.0% |
| Interquartile 75% (IQ3) | 11.3% | 17.6% |
| Interquartile Range (IQR) | 1.9% | 6.7% |
| Standard Deviation (Sample) | 3.6% | 6.3% |
| Standard Deviation (Population) | 3.6% | 6.2% |
Similar Demographics by Male Disability
Demographics Similar to Immigrants from Middle Africa by Male Disability
In terms of male disability, the demographic groups most similar to Immigrants from Middle Africa are Russian (11.1%, a difference of 0.070%), Immigrants from Western Africa (11.1%, a difference of 0.11%), Immigrants from Moldova (11.1%, a difference of 0.14%), Immigrants from Northern Europe (11.1%, a difference of 0.16%), and Latvian (11.1%, a difference of 0.18%).
| Demographics | Rating | Rank | Male Disability |
| Sudanese | 77.1 /100 | #148 | Good 11.0% |
| Immigrants | Denmark | 76.4 /100 | #149 | Good 11.0% |
| Immigrants | Guatemala | 75.1 /100 | #150 | Good 11.0% |
| Cubans | 74.9 /100 | #151 | Good 11.0% |
| Immigrants | Albania | 74.4 /100 | #152 | Good 11.0% |
| Immigrants | Northern Europe | 73.2 /100 | #153 | Good 11.1% |
| Immigrants | Moldova | 72.8 /100 | #154 | Good 11.1% |
| Immigrants | Middle Africa | 70.9 /100 | #155 | Good 11.1% |
| Russians | 69.8 /100 | #156 | Good 11.1% |
| Immigrants | Western Africa | 69.2 /100 | #157 | Good 11.1% |
| Latvians | 68.1 /100 | #158 | Good 11.1% |
| Guatemalans | 67.2 /100 | #159 | Good 11.1% |
| Albanians | 66.5 /100 | #160 | Good 11.1% |
| Immigrants | West Indies | 65.7 /100 | #161 | Good 11.1% |
| Immigrants | Haiti | 65.3 /100 | #162 | Good 11.1% |
Demographics Similar to Inupiat by Male Disability
In terms of male disability, the demographic groups most similar to Inupiat are Nonimmigrants (12.9%, a difference of 0.11%), Immigrants from Micronesia (12.9%, a difference of 0.17%), Pennsylvania German (13.0%, a difference of 0.20%), Marshallese (12.9%, a difference of 0.27%), and Yaqui (12.9%, a difference of 0.51%).
| Demographics | Rating | Rank | Male Disability |
| Pima | 0.0 /100 | #290 | Tragic 12.8% |
| Whites/Caucasians | 0.0 /100 | #291 | Tragic 12.8% |
| English | 0.0 /100 | #292 | Tragic 12.8% |
| Yaqui | 0.0 /100 | #293 | Tragic 12.9% |
| Marshallese | 0.0 /100 | #294 | Tragic 12.9% |
| Immigrants | Micronesia | 0.0 /100 | #295 | Tragic 12.9% |
| Immigrants | Nonimmigrants | 0.0 /100 | #296 | Tragic 12.9% |
| Inupiat | 0.0 /100 | #297 | Tragic 13.0% |
| Pennsylvania Germans | 0.0 /100 | #298 | Tragic 13.0% |
| Celtics | 0.0 /100 | #299 | Tragic 13.0% |
| Cheyenne | 0.0 /100 | #300 | Tragic 13.0% |
| French | 0.0 /100 | #301 | Tragic 13.0% |
| Crow | 0.0 /100 | #302 | Tragic 13.1% |
| Scotch-Irish | 0.0 /100 | #303 | Tragic 13.2% |
| Blacks/African Americans | 0.0 /100 | #304 | Tragic 13.2% |