Finnish vs Albanian Male Disability
COMPARE
Finnish
Albanian
Male Disability
Male Disability Comparison
Finns
Albanians
12.6%
MALE DISABILITY
0.0/ 100
METRIC RATING
277th/ 347
METRIC RANK
11.1%
MALE DISABILITY
66.5/ 100
METRIC RATING
160th/ 347
METRIC RANK
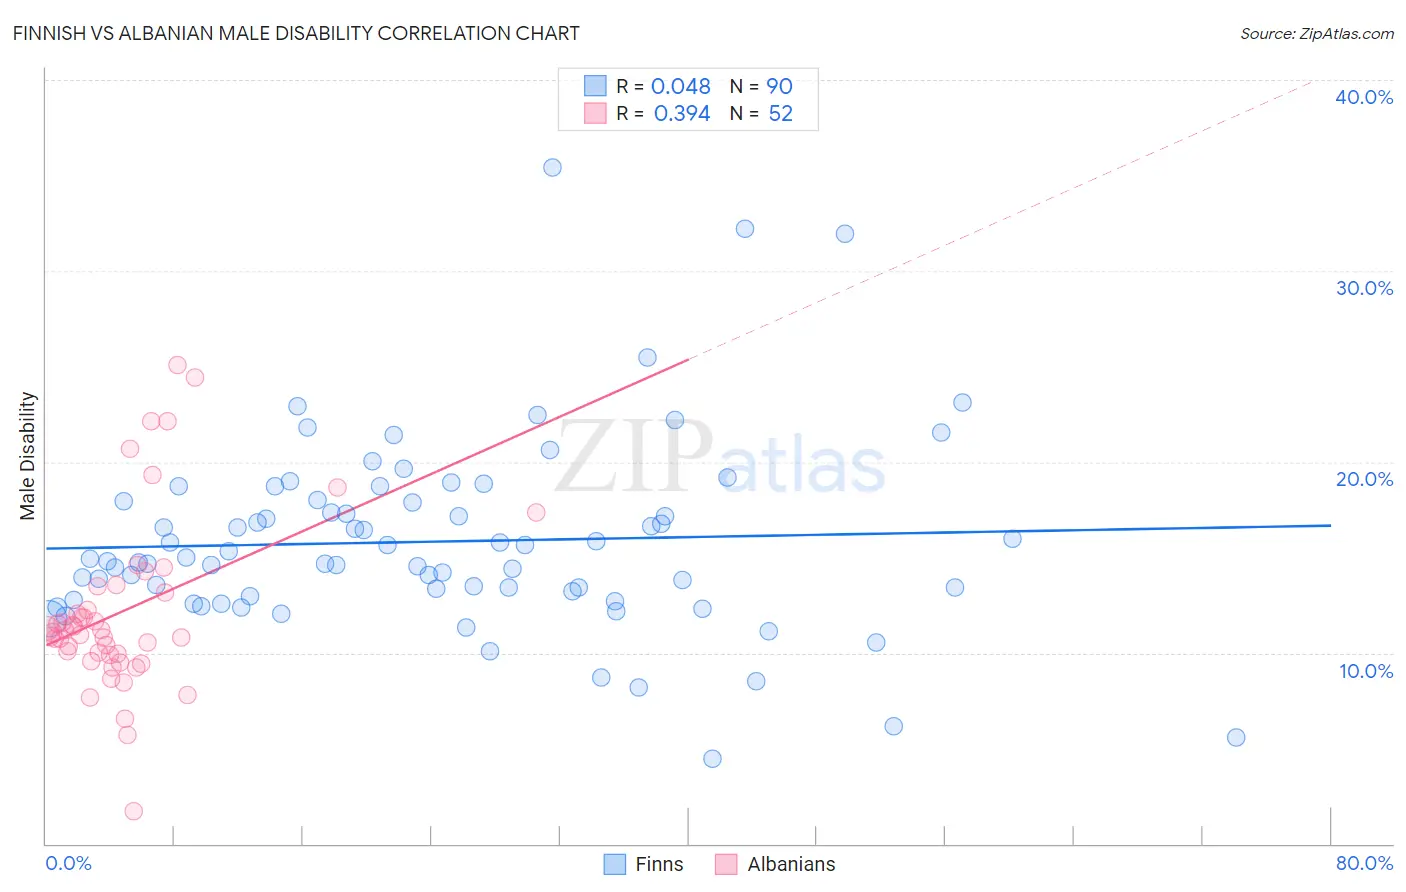
Finnish vs Albanian Male Disability Correlation Chart
The statistical analysis conducted on geographies consisting of 404,606,067 people shows no correlation between the proportion of Finns and percentage of males with a disability in the United States with a correlation coefficient (R) of 0.048 and weighted average of 12.6%. Similarly, the statistical analysis conducted on geographies consisting of 193,257,433 people shows a mild positive correlation between the proportion of Albanians and percentage of males with a disability in the United States with a correlation coefficient (R) of 0.394 and weighted average of 11.1%, a difference of 13.5%.
Male Disability Correlation Summary
| Measurement | Finnish | Albanian |
| Minimum | 4.5% | 1.7% |
| Maximum | 35.4% | 25.0% |
| Range | 30.9% | 23.3% |
| Mean | 15.8% | 12.2% |
| Median | 14.9% | 11.1% |
| Interquartile 25% (IQ1) | 12.9% | 9.9% |
| Interquartile 75% (IQ3) | 18.0% | 13.3% |
| Interquartile Range (IQR) | 5.0% | 3.4% |
| Standard Deviation (Sample) | 5.0% | 4.6% |
| Standard Deviation (Population) | 5.0% | 4.5% |
Similar Demographics by Male Disability
Demographics Similar to Finns by Male Disability
In terms of male disability, the demographic groups most similar to Finns are African (12.6%, a difference of 0.31%), Fijian (12.6%, a difference of 0.37%), Central American Indian (12.7%, a difference of 0.50%), Slovak (12.7%, a difference of 0.65%), and Dutch (12.7%, a difference of 0.70%).
| Demographics | Rating | Rank | Male Disability |
| Spaniards | 0.1 /100 | #270 | Tragic 12.3% |
| Scandinavians | 0.1 /100 | #271 | Tragic 12.3% |
| Hmong | 0.0 /100 | #272 | Tragic 12.5% |
| Native Hawaiians | 0.0 /100 | #273 | Tragic 12.5% |
| Hopi | 0.0 /100 | #274 | Tragic 12.5% |
| Fijians | 0.0 /100 | #275 | Tragic 12.6% |
| Africans | 0.0 /100 | #276 | Tragic 12.6% |
| Finns | 0.0 /100 | #277 | Tragic 12.6% |
| Central American Indians | 0.0 /100 | #278 | Tragic 12.7% |
| Slovaks | 0.0 /100 | #279 | Tragic 12.7% |
| Dutch | 0.0 /100 | #280 | Tragic 12.7% |
| Sioux | 0.0 /100 | #281 | Tragic 12.7% |
| Irish | 0.0 /100 | #282 | Tragic 12.7% |
| Germans | 0.0 /100 | #283 | Tragic 12.7% |
| Spanish | 0.0 /100 | #284 | Tragic 12.7% |
Demographics Similar to Albanians by Male Disability
In terms of male disability, the demographic groups most similar to Albanians are Guatemalan (11.1%, a difference of 0.040%), Immigrants from West Indies (11.1%, a difference of 0.050%), Immigrants from Haiti (11.1%, a difference of 0.070%), Latvian (11.1%, a difference of 0.11%), and Immigrants from Kenya (11.1%, a difference of 0.16%).
| Demographics | Rating | Rank | Male Disability |
| Immigrants | Northern Europe | 73.2 /100 | #153 | Good 11.1% |
| Immigrants | Moldova | 72.8 /100 | #154 | Good 11.1% |
| Immigrants | Middle Africa | 70.9 /100 | #155 | Good 11.1% |
| Russians | 69.8 /100 | #156 | Good 11.1% |
| Immigrants | Western Africa | 69.2 /100 | #157 | Good 11.1% |
| Latvians | 68.1 /100 | #158 | Good 11.1% |
| Guatemalans | 67.2 /100 | #159 | Good 11.1% |
| Albanians | 66.5 /100 | #160 | Good 11.1% |
| Immigrants | West Indies | 65.7 /100 | #161 | Good 11.1% |
| Immigrants | Haiti | 65.3 /100 | #162 | Good 11.1% |
| Immigrants | Kenya | 63.8 /100 | #163 | Good 11.1% |
| British West Indians | 62.8 /100 | #164 | Good 11.1% |
| Luxembourgers | 61.9 /100 | #165 | Good 11.1% |
| Immigrants | Hungary | 61.2 /100 | #166 | Good 11.1% |
| Immigrants | Southern Europe | 54.4 /100 | #167 | Average 11.2% |