Finnish vs Immigrants from Jordan Disability Age 5 to 17
COMPARE
Finnish
Immigrants from Jordan
Disability Age 5 to 17
Disability Age 5 to 17 Comparison
Finns
Immigrants from Jordan
6.0%
DISABILITY AGE 5 TO 17
0.2/ 100
METRIC RATING
272nd/ 347
METRIC RANK
5.3%
DISABILITY AGE 5 TO 17
99.1/ 100
METRIC RATING
94th/ 347
METRIC RANK
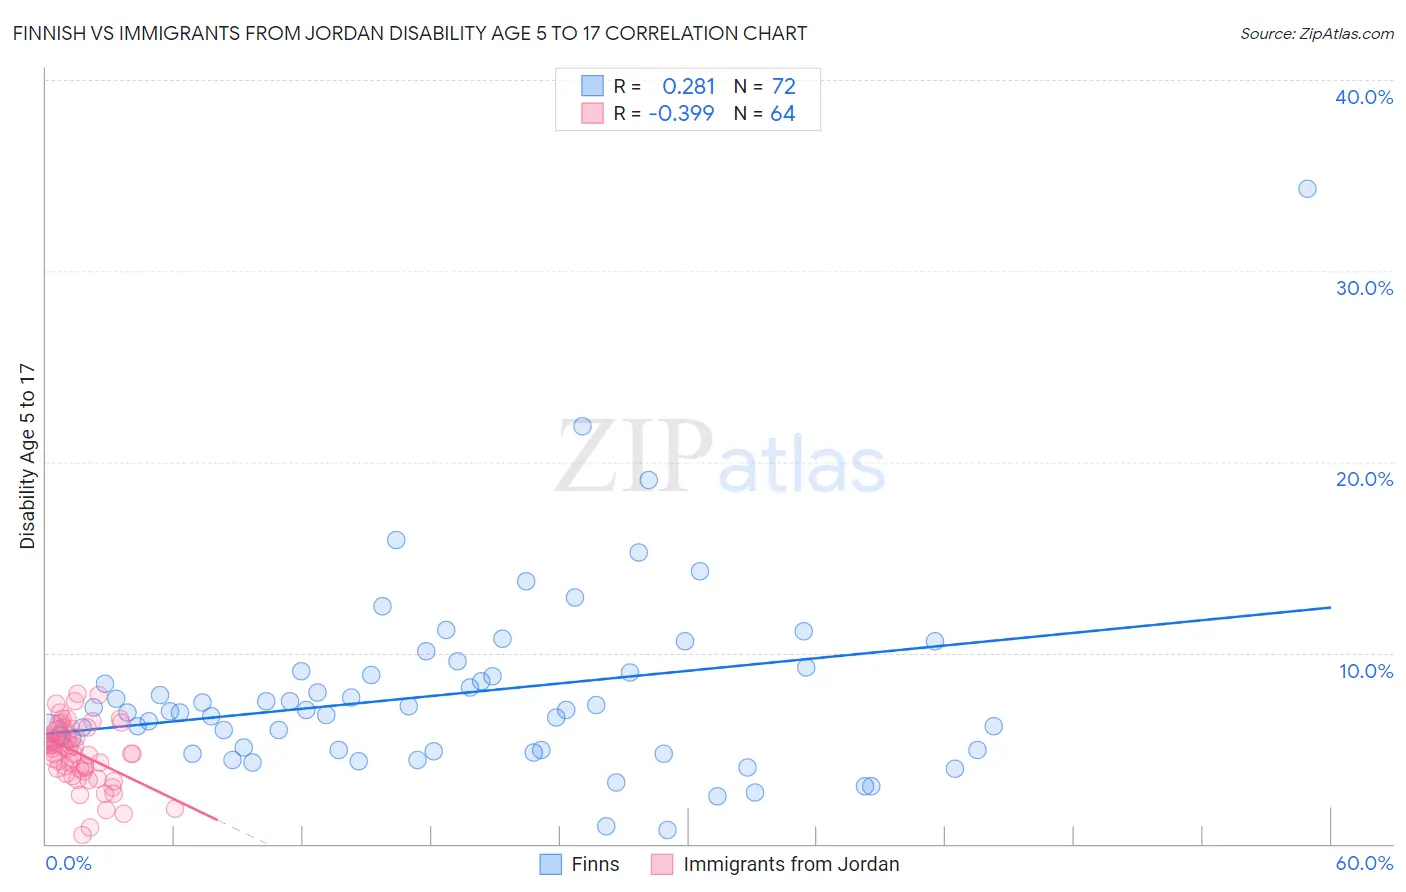
Finnish vs Immigrants from Jordan Disability Age 5 to 17 Correlation Chart
The statistical analysis conducted on geographies consisting of 400,280,382 people shows a weak positive correlation between the proportion of Finns and percentage of population with a disability between the ages 5 and 17 in the United States with a correlation coefficient (R) of 0.281 and weighted average of 6.0%. Similarly, the statistical analysis conducted on geographies consisting of 180,773,997 people shows a mild negative correlation between the proportion of Immigrants from Jordan and percentage of population with a disability between the ages 5 and 17 in the United States with a correlation coefficient (R) of -0.399 and weighted average of 5.3%, a difference of 14.3%.
Disability Age 5 to 17 Correlation Summary
| Measurement | Finnish | Immigrants from Jordan |
| Minimum | 0.71% | 0.46% |
| Maximum | 34.3% | 7.9% |
| Range | 33.6% | 7.4% |
| Mean | 7.9% | 4.7% |
| Median | 7.0% | 5.0% |
| Interquartile 25% (IQ1) | 4.9% | 3.8% |
| Interquartile 75% (IQ3) | 9.0% | 5.9% |
| Interquartile Range (IQR) | 4.1% | 2.1% |
| Standard Deviation (Sample) | 5.0% | 1.6% |
| Standard Deviation (Population) | 4.9% | 1.6% |
Similar Demographics by Disability Age 5 to 17
Demographics Similar to Finns by Disability Age 5 to 17
In terms of disability age 5 to 17, the demographic groups most similar to Finns are Immigrants from Zaire (6.0%, a difference of 0.030%), Alaska Native (6.0%, a difference of 0.050%), Cheyenne (6.0%, a difference of 0.16%), Dutch (6.0%, a difference of 0.27%), and Japanese (6.1%, a difference of 0.38%).
| Demographics | Rating | Rank | Disability Age 5 to 17 |
| Panamanians | 0.6 /100 | #265 | Tragic 6.0% |
| Slovenes | 0.6 /100 | #266 | Tragic 6.0% |
| Spanish | 0.5 /100 | #267 | Tragic 6.0% |
| Sioux | 0.4 /100 | #268 | Tragic 6.0% |
| Liberians | 0.4 /100 | #269 | Tragic 6.0% |
| Immigrants | Somalia | 0.4 /100 | #270 | Tragic 6.0% |
| Immigrants | Zaire | 0.2 /100 | #271 | Tragic 6.0% |
| Finns | 0.2 /100 | #272 | Tragic 6.0% |
| Alaska Natives | 0.2 /100 | #273 | Tragic 6.0% |
| Cheyenne | 0.2 /100 | #274 | Tragic 6.0% |
| Dutch | 0.2 /100 | #275 | Tragic 6.0% |
| Japanese | 0.1 /100 | #276 | Tragic 6.1% |
| Puget Sound Salish | 0.1 /100 | #277 | Tragic 6.1% |
| Immigrants | Liberia | 0.1 /100 | #278 | Tragic 6.1% |
| Immigrants | Jamaica | 0.1 /100 | #279 | Tragic 6.1% |
Demographics Similar to Immigrants from Jordan by Disability Age 5 to 17
In terms of disability age 5 to 17, the demographic groups most similar to Immigrants from Jordan are Immigrants from Grenada (5.3%, a difference of 0.020%), Immigrants from Peru (5.3%, a difference of 0.070%), Luxembourger (5.3%, a difference of 0.14%), Mongolian (5.3%, a difference of 0.16%), and Immigrants from El Salvador (5.3%, a difference of 0.18%).
| Demographics | Rating | Rank | Disability Age 5 to 17 |
| Eastern Europeans | 99.4 /100 | #87 | Exceptional 5.2% |
| Immigrants | Croatia | 99.4 /100 | #88 | Exceptional 5.2% |
| Immigrants | Spain | 99.4 /100 | #89 | Exceptional 5.2% |
| Immigrants | Kuwait | 99.4 /100 | #90 | Exceptional 5.3% |
| Mongolians | 99.2 /100 | #91 | Exceptional 5.3% |
| Luxembourgers | 99.2 /100 | #92 | Exceptional 5.3% |
| Immigrants | Peru | 99.1 /100 | #93 | Exceptional 5.3% |
| Immigrants | Jordan | 99.1 /100 | #94 | Exceptional 5.3% |
| Immigrants | Grenada | 99.1 /100 | #95 | Exceptional 5.3% |
| Immigrants | El Salvador | 99.0 /100 | #96 | Exceptional 5.3% |
| Immigrants | Europe | 99.0 /100 | #97 | Exceptional 5.3% |
| Immigrants | Austria | 98.9 /100 | #98 | Exceptional 5.3% |
| Cambodians | 98.8 /100 | #99 | Exceptional 5.3% |
| Nepalese | 98.7 /100 | #100 | Exceptional 5.3% |
| Menominee | 98.7 /100 | #101 | Exceptional 5.3% |