Finnish vs Subsaharan African Disability Age 5 to 17
COMPARE
Finnish
Subsaharan African
Disability Age 5 to 17
Disability Age 5 to 17 Comparison
Finns
Sub-Saharan Africans
6.0%
DISABILITY AGE 5 TO 17
0.2/ 100
METRIC RATING
272nd/ 347
METRIC RANK
6.2%
DISABILITY AGE 5 TO 17
0.0/ 100
METRIC RATING
284th/ 347
METRIC RANK
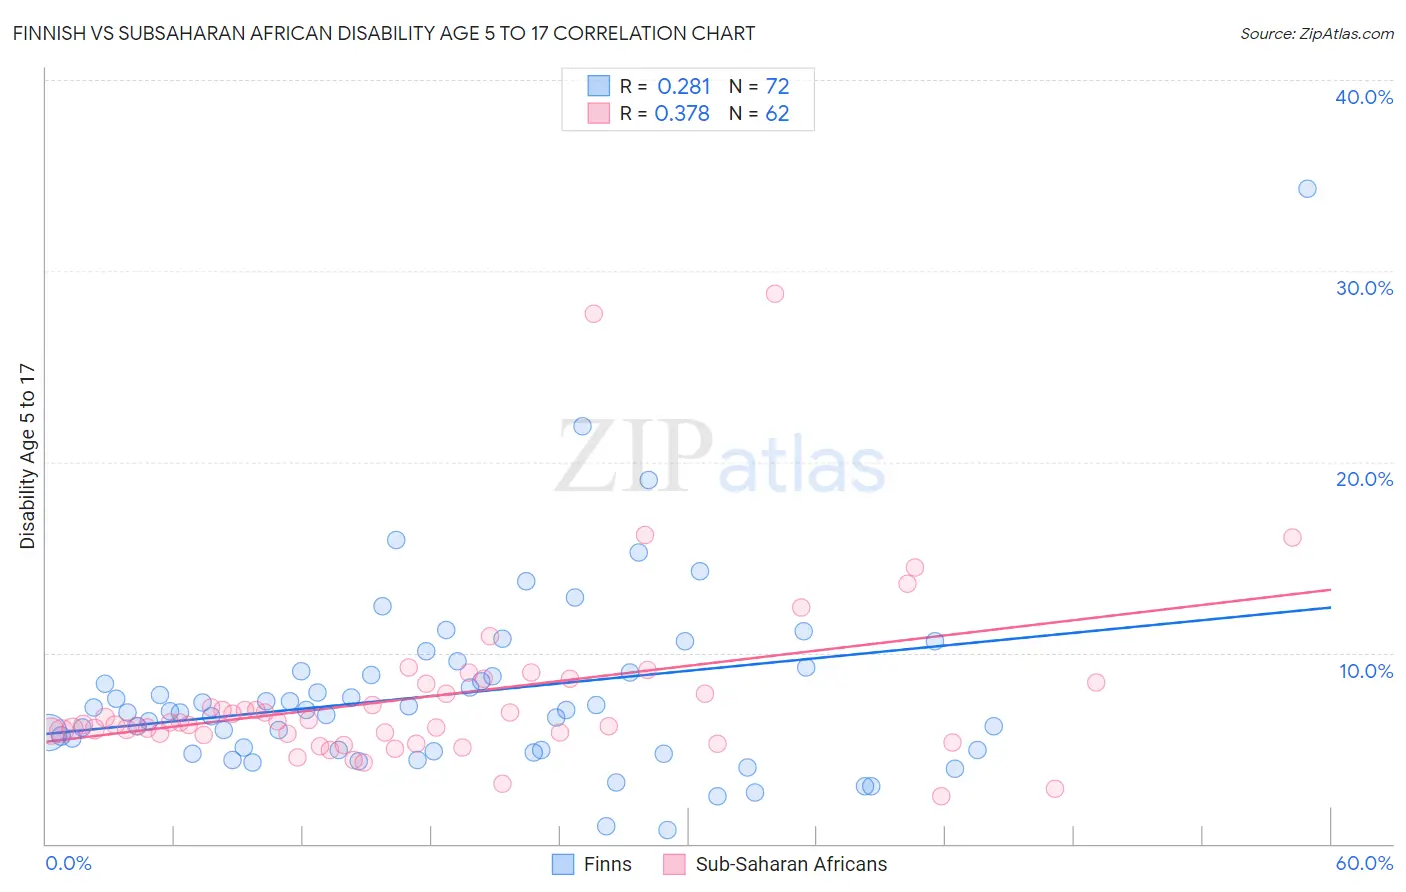
Finnish vs Subsaharan African Disability Age 5 to 17 Correlation Chart
The statistical analysis conducted on geographies consisting of 400,280,382 people shows a weak positive correlation between the proportion of Finns and percentage of population with a disability between the ages 5 and 17 in the United States with a correlation coefficient (R) of 0.281 and weighted average of 6.0%. Similarly, the statistical analysis conducted on geographies consisting of 502,132,058 people shows a mild positive correlation between the proportion of Sub-Saharan Africans and percentage of population with a disability between the ages 5 and 17 in the United States with a correlation coefficient (R) of 0.378 and weighted average of 6.2%, a difference of 2.2%.
Disability Age 5 to 17 Correlation Summary
| Measurement | Finnish | Subsaharan African |
| Minimum | 0.71% | 2.5% |
| Maximum | 34.3% | 28.8% |
| Range | 33.6% | 26.3% |
| Mean | 7.9% | 7.7% |
| Median | 7.0% | 6.3% |
| Interquartile 25% (IQ1) | 4.9% | 5.7% |
| Interquartile 75% (IQ3) | 9.0% | 8.4% |
| Interquartile Range (IQR) | 4.1% | 2.7% |
| Standard Deviation (Sample) | 5.0% | 4.7% |
| Standard Deviation (Population) | 4.9% | 4.6% |
Demographics Similar to Finns and Sub-Saharan Africans by Disability Age 5 to 17
In terms of disability age 5 to 17, the demographic groups most similar to Finns are Immigrants from Zaire (6.0%, a difference of 0.030%), Alaska Native (6.0%, a difference of 0.050%), Cheyenne (6.0%, a difference of 0.16%), Dutch (6.0%, a difference of 0.27%), and Japanese (6.1%, a difference of 0.38%). Similarly, the demographic groups most similar to Sub-Saharan Africans are English (6.2%, a difference of 0.0%), Ugandan (6.2%, a difference of 0.030%), Colville (6.2%, a difference of 0.040%), German (6.1%, a difference of 0.19%), and Pima (6.2%, a difference of 0.23%).
| Demographics | Rating | Rank | Disability Age 5 to 17 |
| Sioux | 0.4 /100 | #268 | Tragic 6.0% |
| Liberians | 0.4 /100 | #269 | Tragic 6.0% |
| Immigrants | Somalia | 0.4 /100 | #270 | Tragic 6.0% |
| Immigrants | Zaire | 0.2 /100 | #271 | Tragic 6.0% |
| Finns | 0.2 /100 | #272 | Tragic 6.0% |
| Alaska Natives | 0.2 /100 | #273 | Tragic 6.0% |
| Cheyenne | 0.2 /100 | #274 | Tragic 6.0% |
| Dutch | 0.2 /100 | #275 | Tragic 6.0% |
| Japanese | 0.1 /100 | #276 | Tragic 6.1% |
| Puget Sound Salish | 0.1 /100 | #277 | Tragic 6.1% |
| Immigrants | Liberia | 0.1 /100 | #278 | Tragic 6.1% |
| Immigrants | Jamaica | 0.1 /100 | #279 | Tragic 6.1% |
| Portuguese | 0.1 /100 | #280 | Tragic 6.1% |
| Scottish | 0.0 /100 | #281 | Tragic 6.1% |
| Germans | 0.0 /100 | #282 | Tragic 6.1% |
| Ugandans | 0.0 /100 | #283 | Tragic 6.2% |
| Sub-Saharan Africans | 0.0 /100 | #284 | Tragic 6.2% |
| English | 0.0 /100 | #285 | Tragic 6.2% |
| Colville | 0.0 /100 | #286 | Tragic 6.2% |
| Pima | 0.0 /100 | #287 | Tragic 6.2% |
| Jamaicans | 0.0 /100 | #288 | Tragic 6.2% |